5 September 2026 · Squamish Airport and Pam Rocks
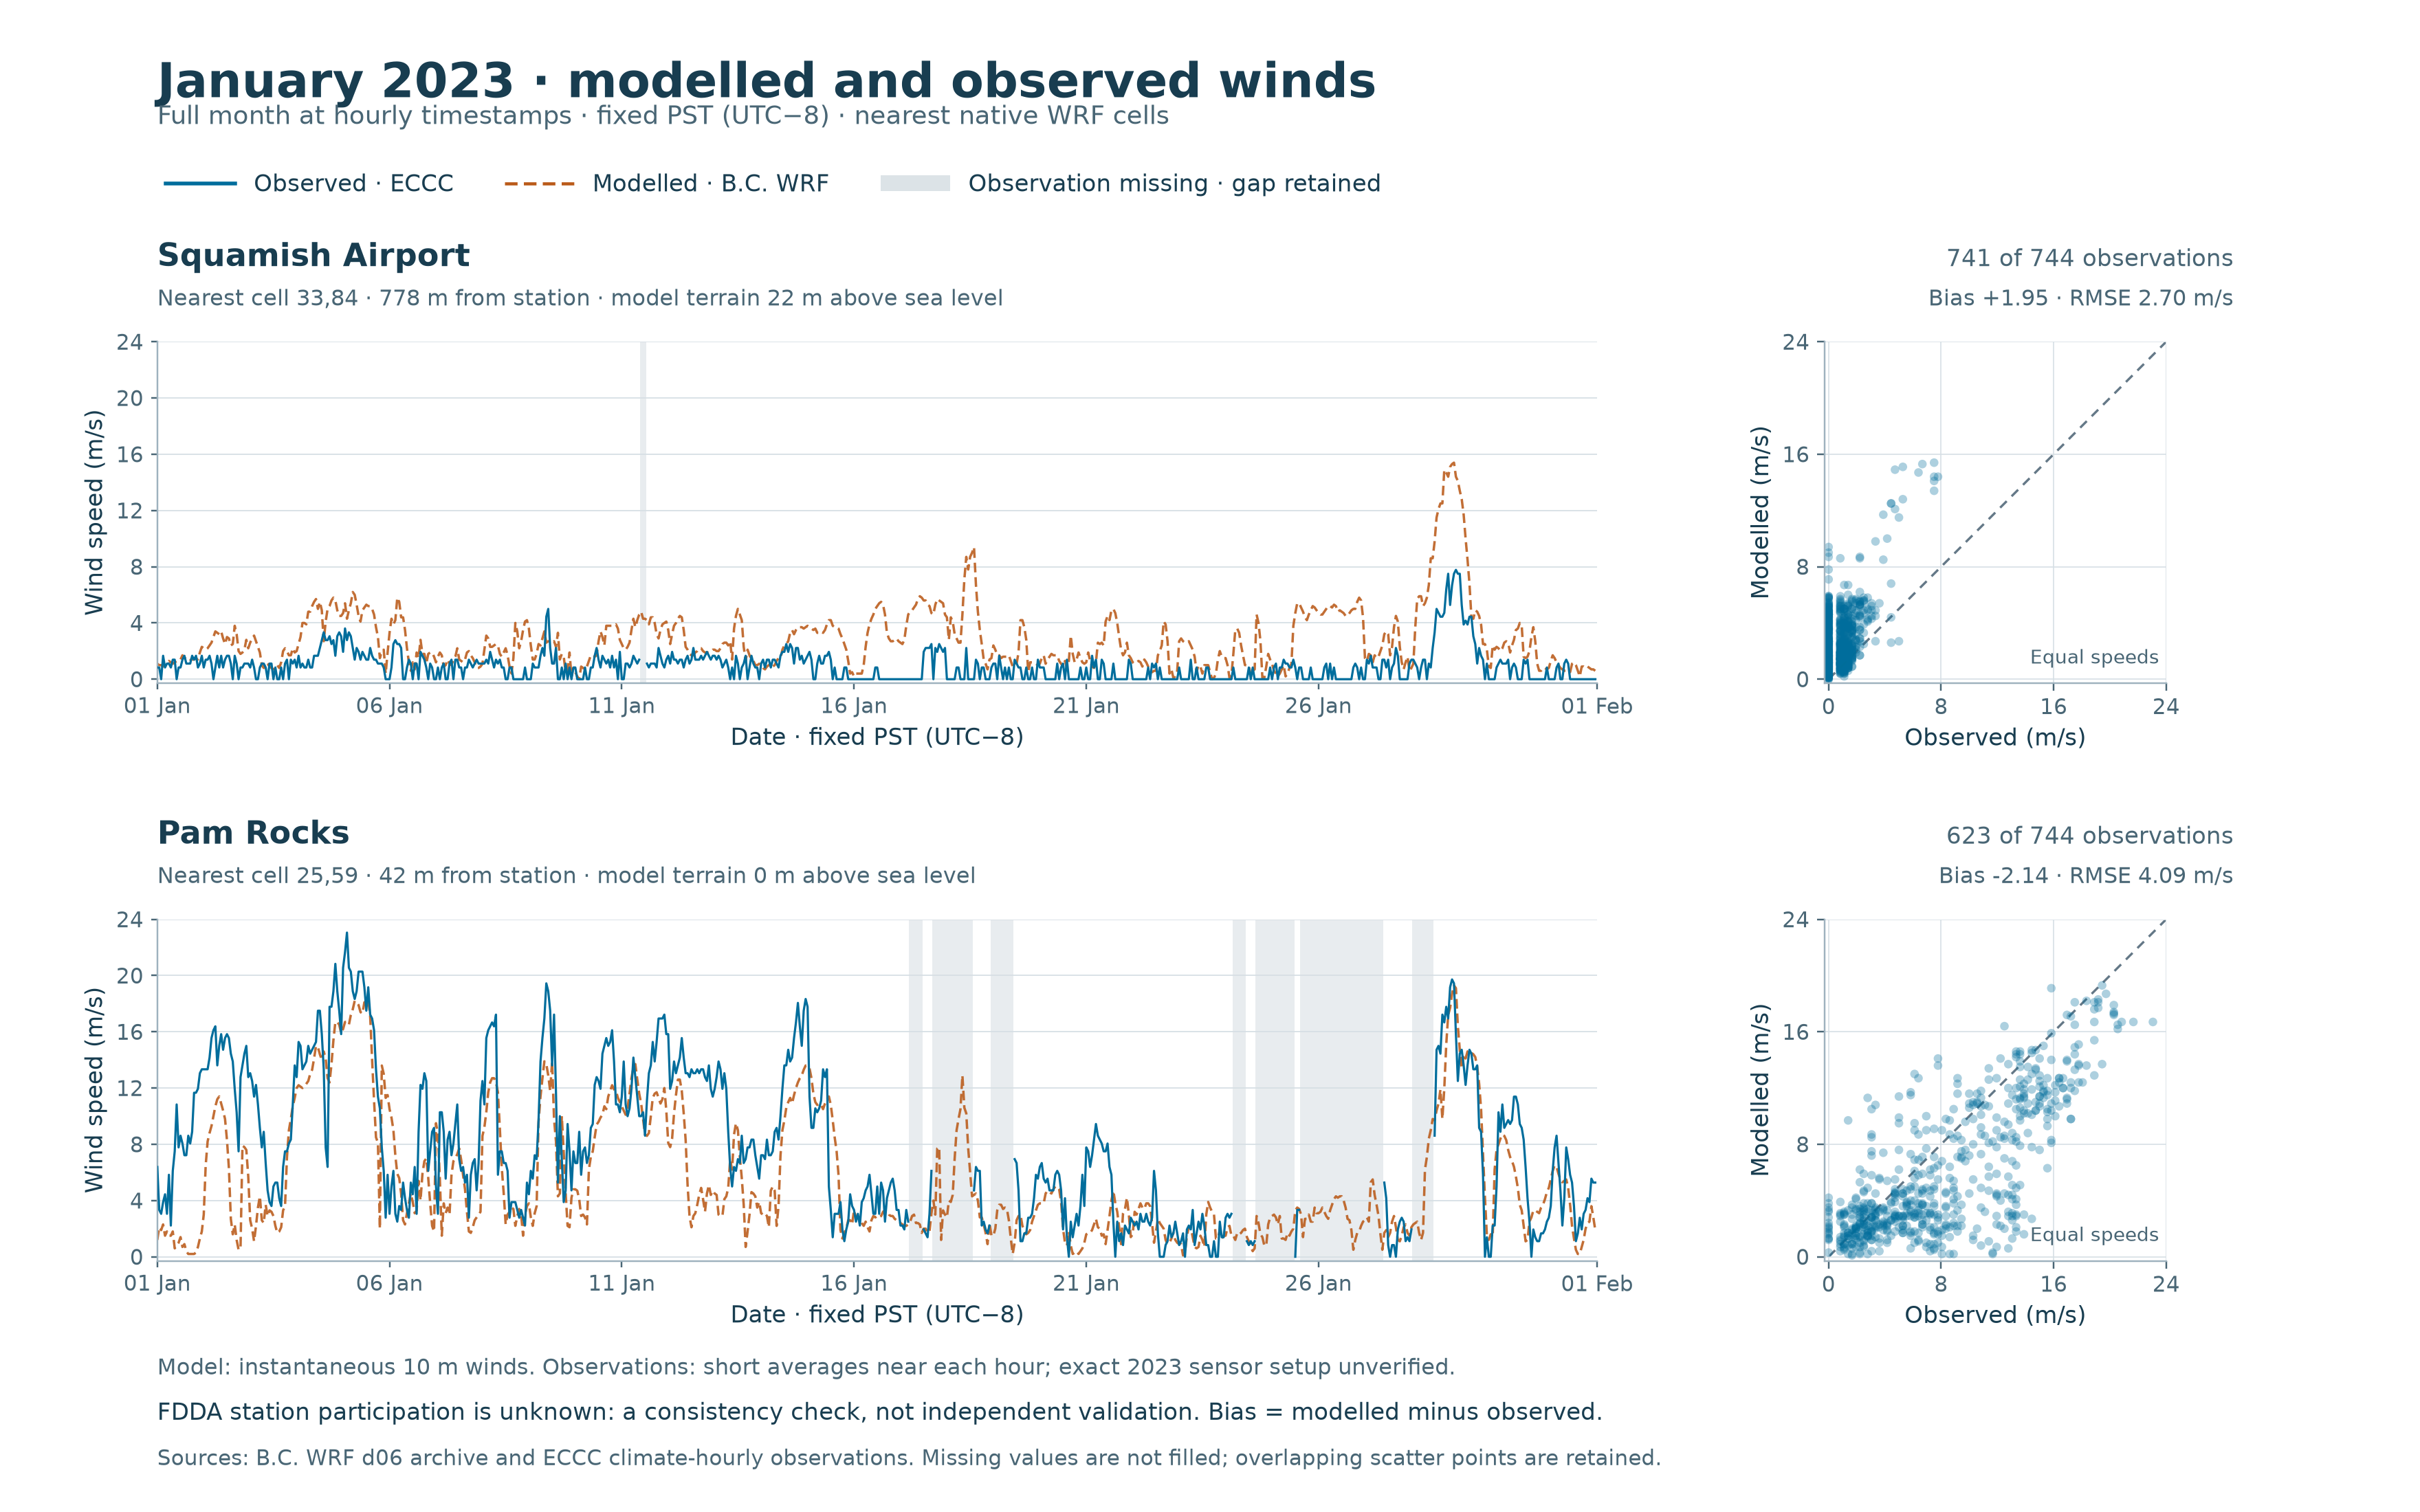
The January comparison finds different wind-speed errors at the two stations: B.C.’s regional model is windier than the available Airport observations on average, while its mean is lower than observed during the predeclared Pam Rocks strong-northerly subset. These differences matter when assessing whether a weather dataset can support local plume calculations.
The full January calendar month and comparison rules were selected before calculating January model errors. The archive uses data assimilation; the contribution of these stations remains unresolved. This is a consistency check, not independent weather validation.
| January 2023, available matched hours | Squamish Airport | Pam Rocks |
|---|---|---|
| Matched timestamps | 741 of 744 | 623 of 744 |
| Mean observed speed | 0.92 m/s | 8.03 m/s |
| Mean modelled speed | 2.88 m/s | 5.89 m/s |
| Mean model-minus-observation difference | +1.95 m/s | −2.14 m/s |
| Wind-vector error, RMSE | 3.18 m/s | 5.71 m/s |
Wind-vector error includes speed and direction together. For pairs with both speeds at least 1 m/s, direction differences exceeded 90° in 22 of 286 Airport pairs and 94 of 558 Pam Rocks pairs. Their average absolute direction differences were 43.3° and 42.2°.
The Airport reported zero speed at 294 timestamps. At those times, the model’s median speed was 1.9 m/s and its maximum was 9.4 m/s. Pam Rocks had 17 reported zeros, with model median 2.1 m/s and maximum 4.2 m/s. Reported zero is retained without assigning an unverified instrument detection threshold.
The Airport is missing three hours on January 11. Pam Rocks is missing 121 hours in seven clusters between January 17 and 28. These hours remain gaps; the monthly statistics describe available pairs, and may not represent the missing periods.
The predeclared subset selects Pam Rocks observations of at least 5 m/s from the north-centred sector, 315° through north to 45°. This is relevant to investigating winter outflow, but surface wind alone does not identify its driving mechanism or establish an inversion.
There are 389 selected timestamps, 234 observed timestamps outside the subset and 121 unclassifiable timestamps with missing Pam observations. Both stations are evaluated at the same selected times. Three of the Airport observations are absent.
| During the selected Pam Rocks conditions | Squamish Airport | Pam Rocks |
|---|---|---|
| Available pairs | 386 of 389 | 389 of 389 |
| Mean observed speed | 1.36 m/s | 11.23 m/s |
| Mean modelled speed | 3.08 m/s | 7.67 m/s |
| Mean model-minus-observation difference | +1.73 m/s | −3.56 m/s |
| Wind-vector error, RMSE | 3.18 m/s | 6.57 m/s |
This observation-selected subset is conditional on strong winds, so its speed difference must not be generalized to all winds. It shows the model’s behaviour during the specified observed conditions. Among its 373 Pam Rocks pairs with both speeds at least 1 m/s, 39 direction differences exceeded 90°. All selected times remain in the downloadable data; no episodes were chosen because of their model error.
January adds a winter case to the June comparison. Two months, incomplete observations and surface stations do not establish year-round performance, elevated plume winds or inversion structure. The results support testing local wind and vertical structure before adopting this archive as the simulation’s weather input.
The next records to obtain are the archive’s actual configuration and assimilated station/time inventory, dated station exposure and averaging records, and source-site wind and temperature profiles. Further public-source checks have not recovered those records; no external inquiry has been sent. The interactive explorer retains its labelled illustrative scenarios.
Methods and sources · Hourly pairs · Strong-northerly classifications · Summary statistics · Reproduction kit · Research plan