5 September 2026 · Squamish Airport and Pam Rocks
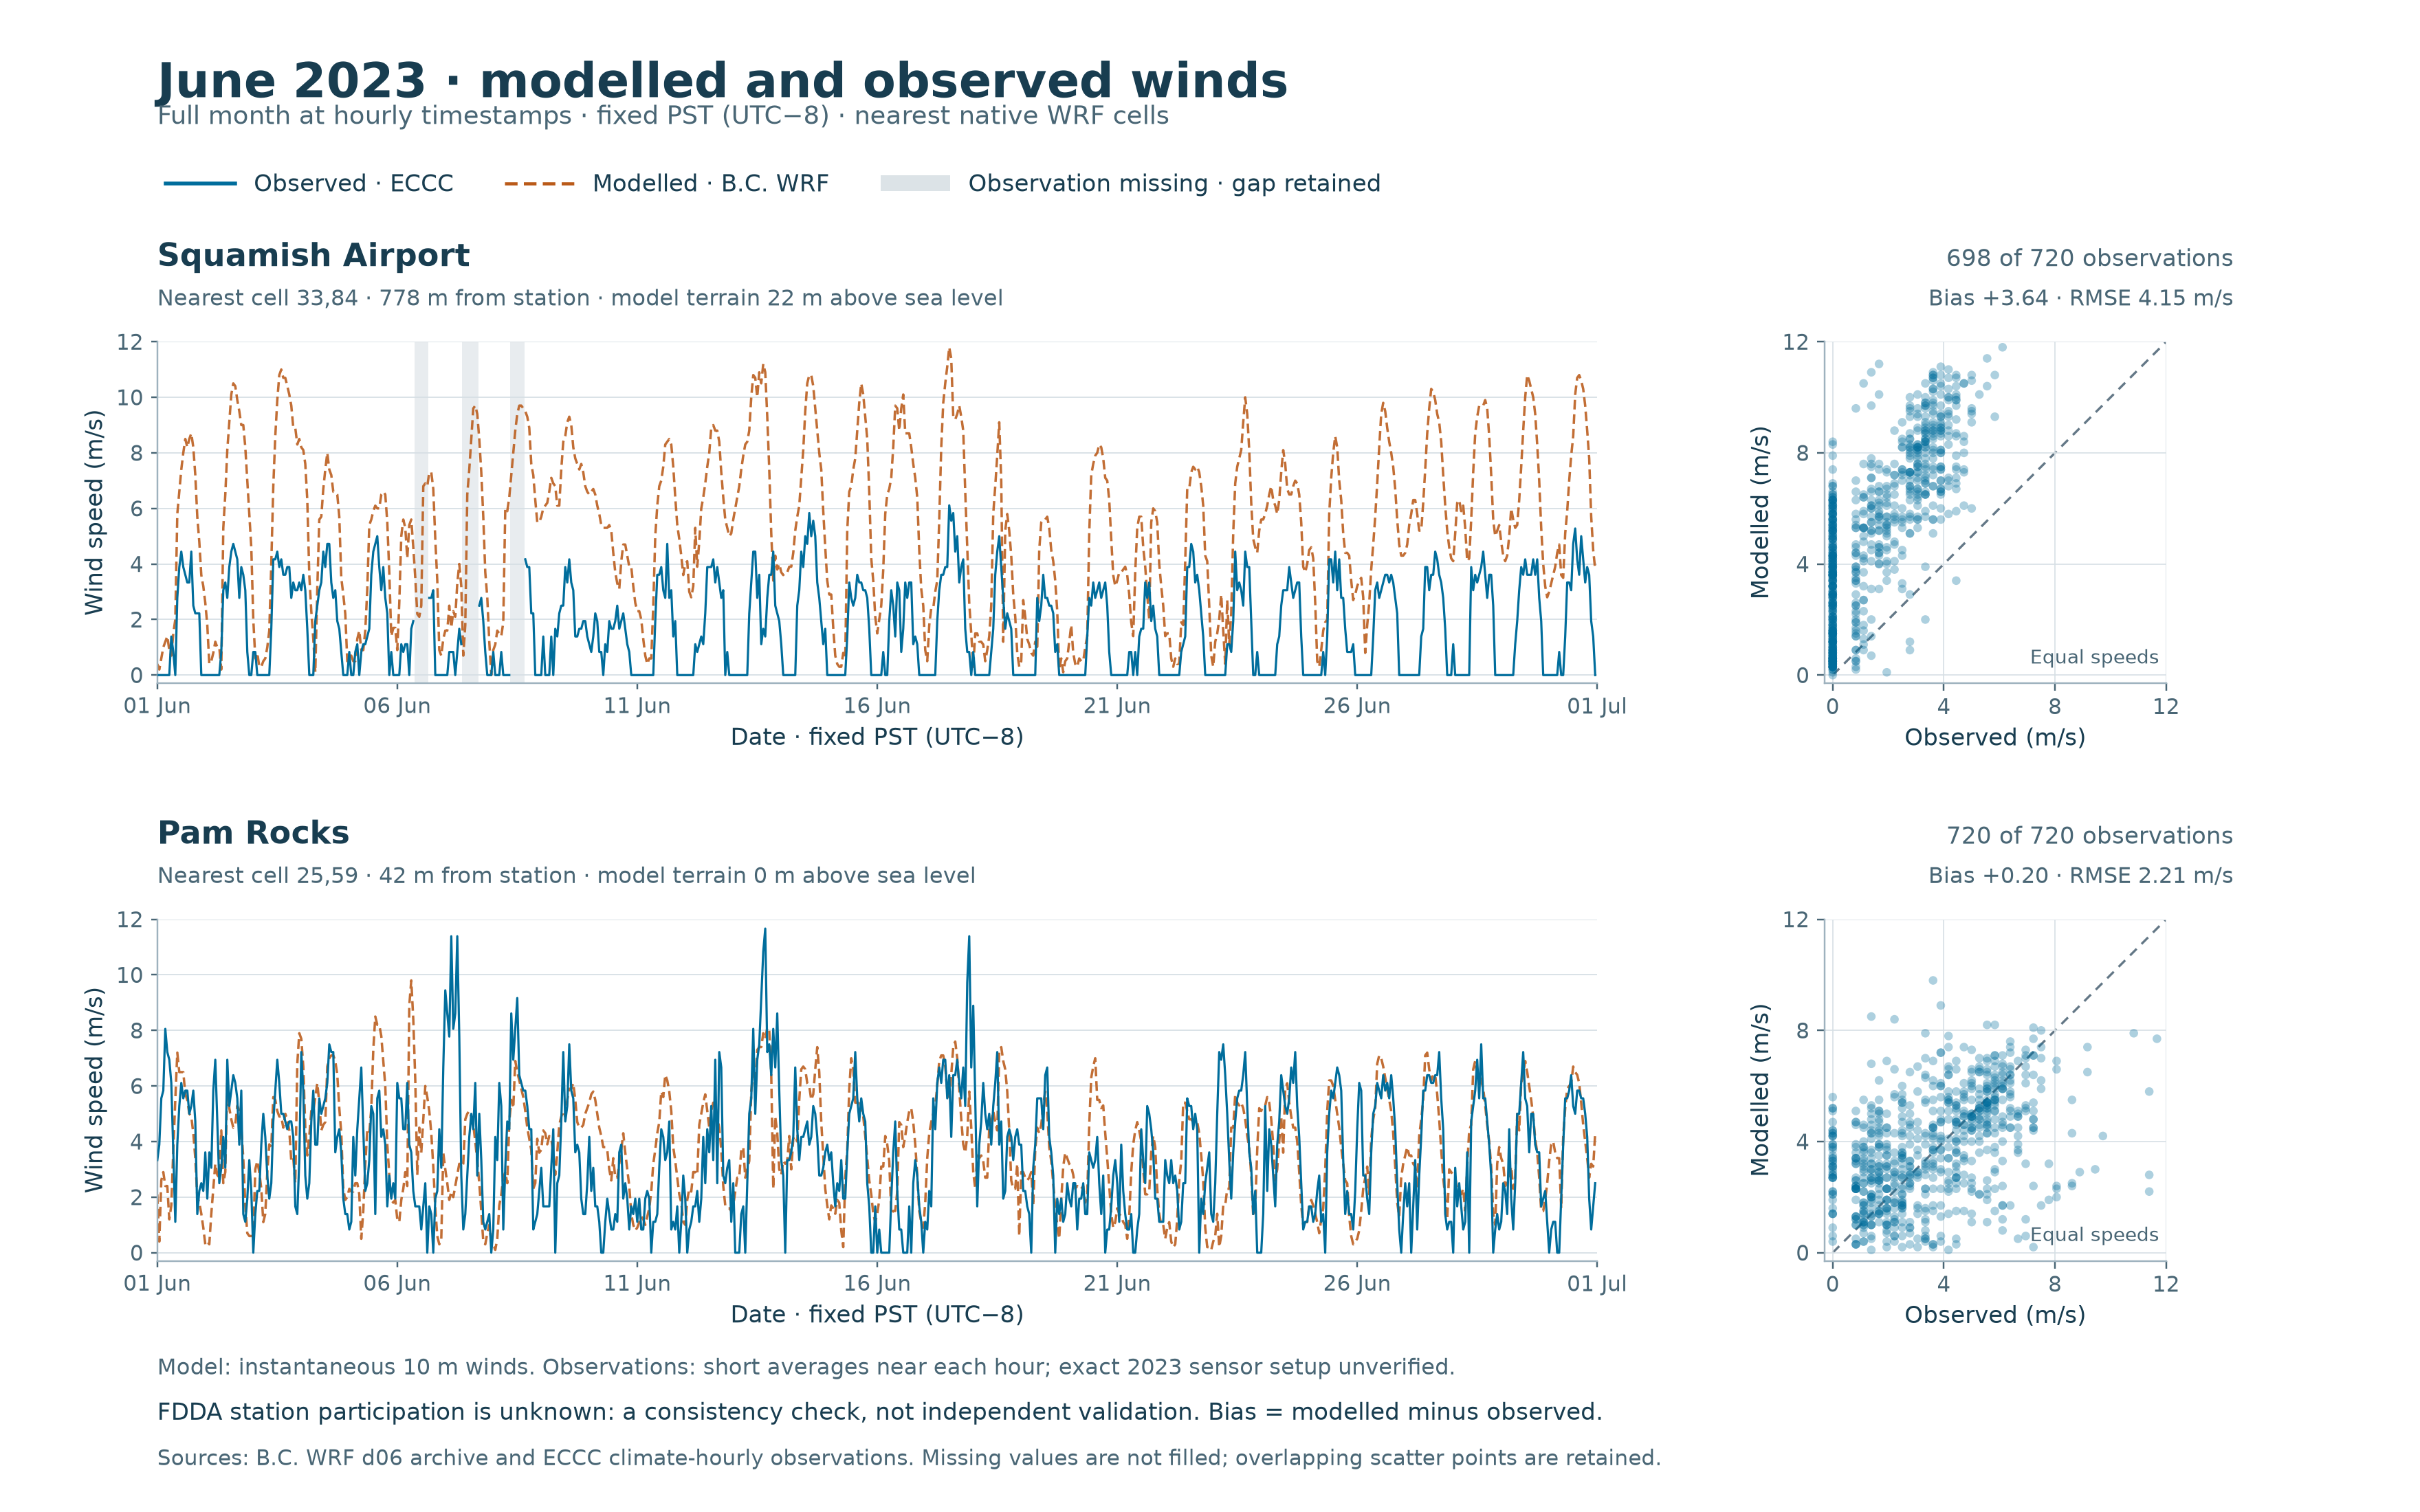
A full-month comparison identifies two problems to resolve before using B.C.’s regional weather archive for local plume calculations: winds are substantially stronger than observed at the nearest Squamish Airport model cell, while Pam Rocks’ similar monthly mean speed conceals considerable direction differences.
These are June 2023 results, using fixed station locations and comparison rules written before the errors were calculated. The model archive uses data assimilation; we do not yet know whether these stations contributed to it. This is therefore a consistency check, not independent validation.
| June 2023, available matched hours | Squamish Airport | Pam Rocks |
|---|---|---|
| Matched hourly timestamps | 698 of 720 | 720 of 720 |
| Mean observed speed | 1.64 m/s | 3.55 m/s |
| Mean modelled speed | 5.27 m/s | 3.75 m/s |
| Mean model-minus-observation difference | +3.64 m/s | +0.20 m/s |
| Wind-vector error, RMSE | 4.79 m/s | 3.68 m/s |
Wind-vector error includes both speed and direction. A small monthly mean-speed difference can coexist with large errors at individual hours.
For hours when both winds were at least 1 m/s, direction differences exceeded 90° in 16 of 373 Airport pairs and 114 of 596 Pam Rocks pairs. The average absolute direction differences were 38.3° and 49.0°, respectively. These thresholds describe this comparison; they are not air-quality or health limits. Results at two other predeclared wind-speed thresholds are included in the data.
The Airport recorded zero wind speed at 277 timestamps. At those timestamps the model’s median speed was 2.90 m/s, with a maximum of 8.40 m/s. Pam Rocks had 46 reported zeros; the corresponding model median was 3.15 m/s. A reported zero is retained as recorded, without inventing the instrument’s detection threshold.
The Airport’s 22 missing observations fall on June 6–8 during daytime. They are visible as gaps and are excluded from paired statistics. No value was filled. The full period is June 1–30 in fixed Pacific Standard Time; the earlier June 2 UTC profile sample is also reported separately as a subset of this month.
Using the retained ECCC coordinates, the selected Airport cell is about 778 m from the station; Pam Rocks’ is about 42 m away. Their model terrain elevations are 22 m and 0 m, compared with current catalogue elevations of 53.7 m and 7.1 m. These differences are context, not a demonstrated explanation for the wind errors or a basis for correcting them.
WMO registry records list nominal 10 m wind deployments dating from 2016, but leave the reference surface and important setup details unresolved. The next priorities are to establish dated station exposure and averaging details, obtain the archive’s assimilation and configuration records, and test additional seasons and vertical profiles. One June month does not test winter inversions or establish winds at the flare’s height. The plume explorer continues to use its labelled illustrative scenarios.
Methods and exact sources · Hourly paired data · Summary statistics · Direction sensitivities · Reproduction kit
The regional vertical-profile sample and research plan provide the broader context.