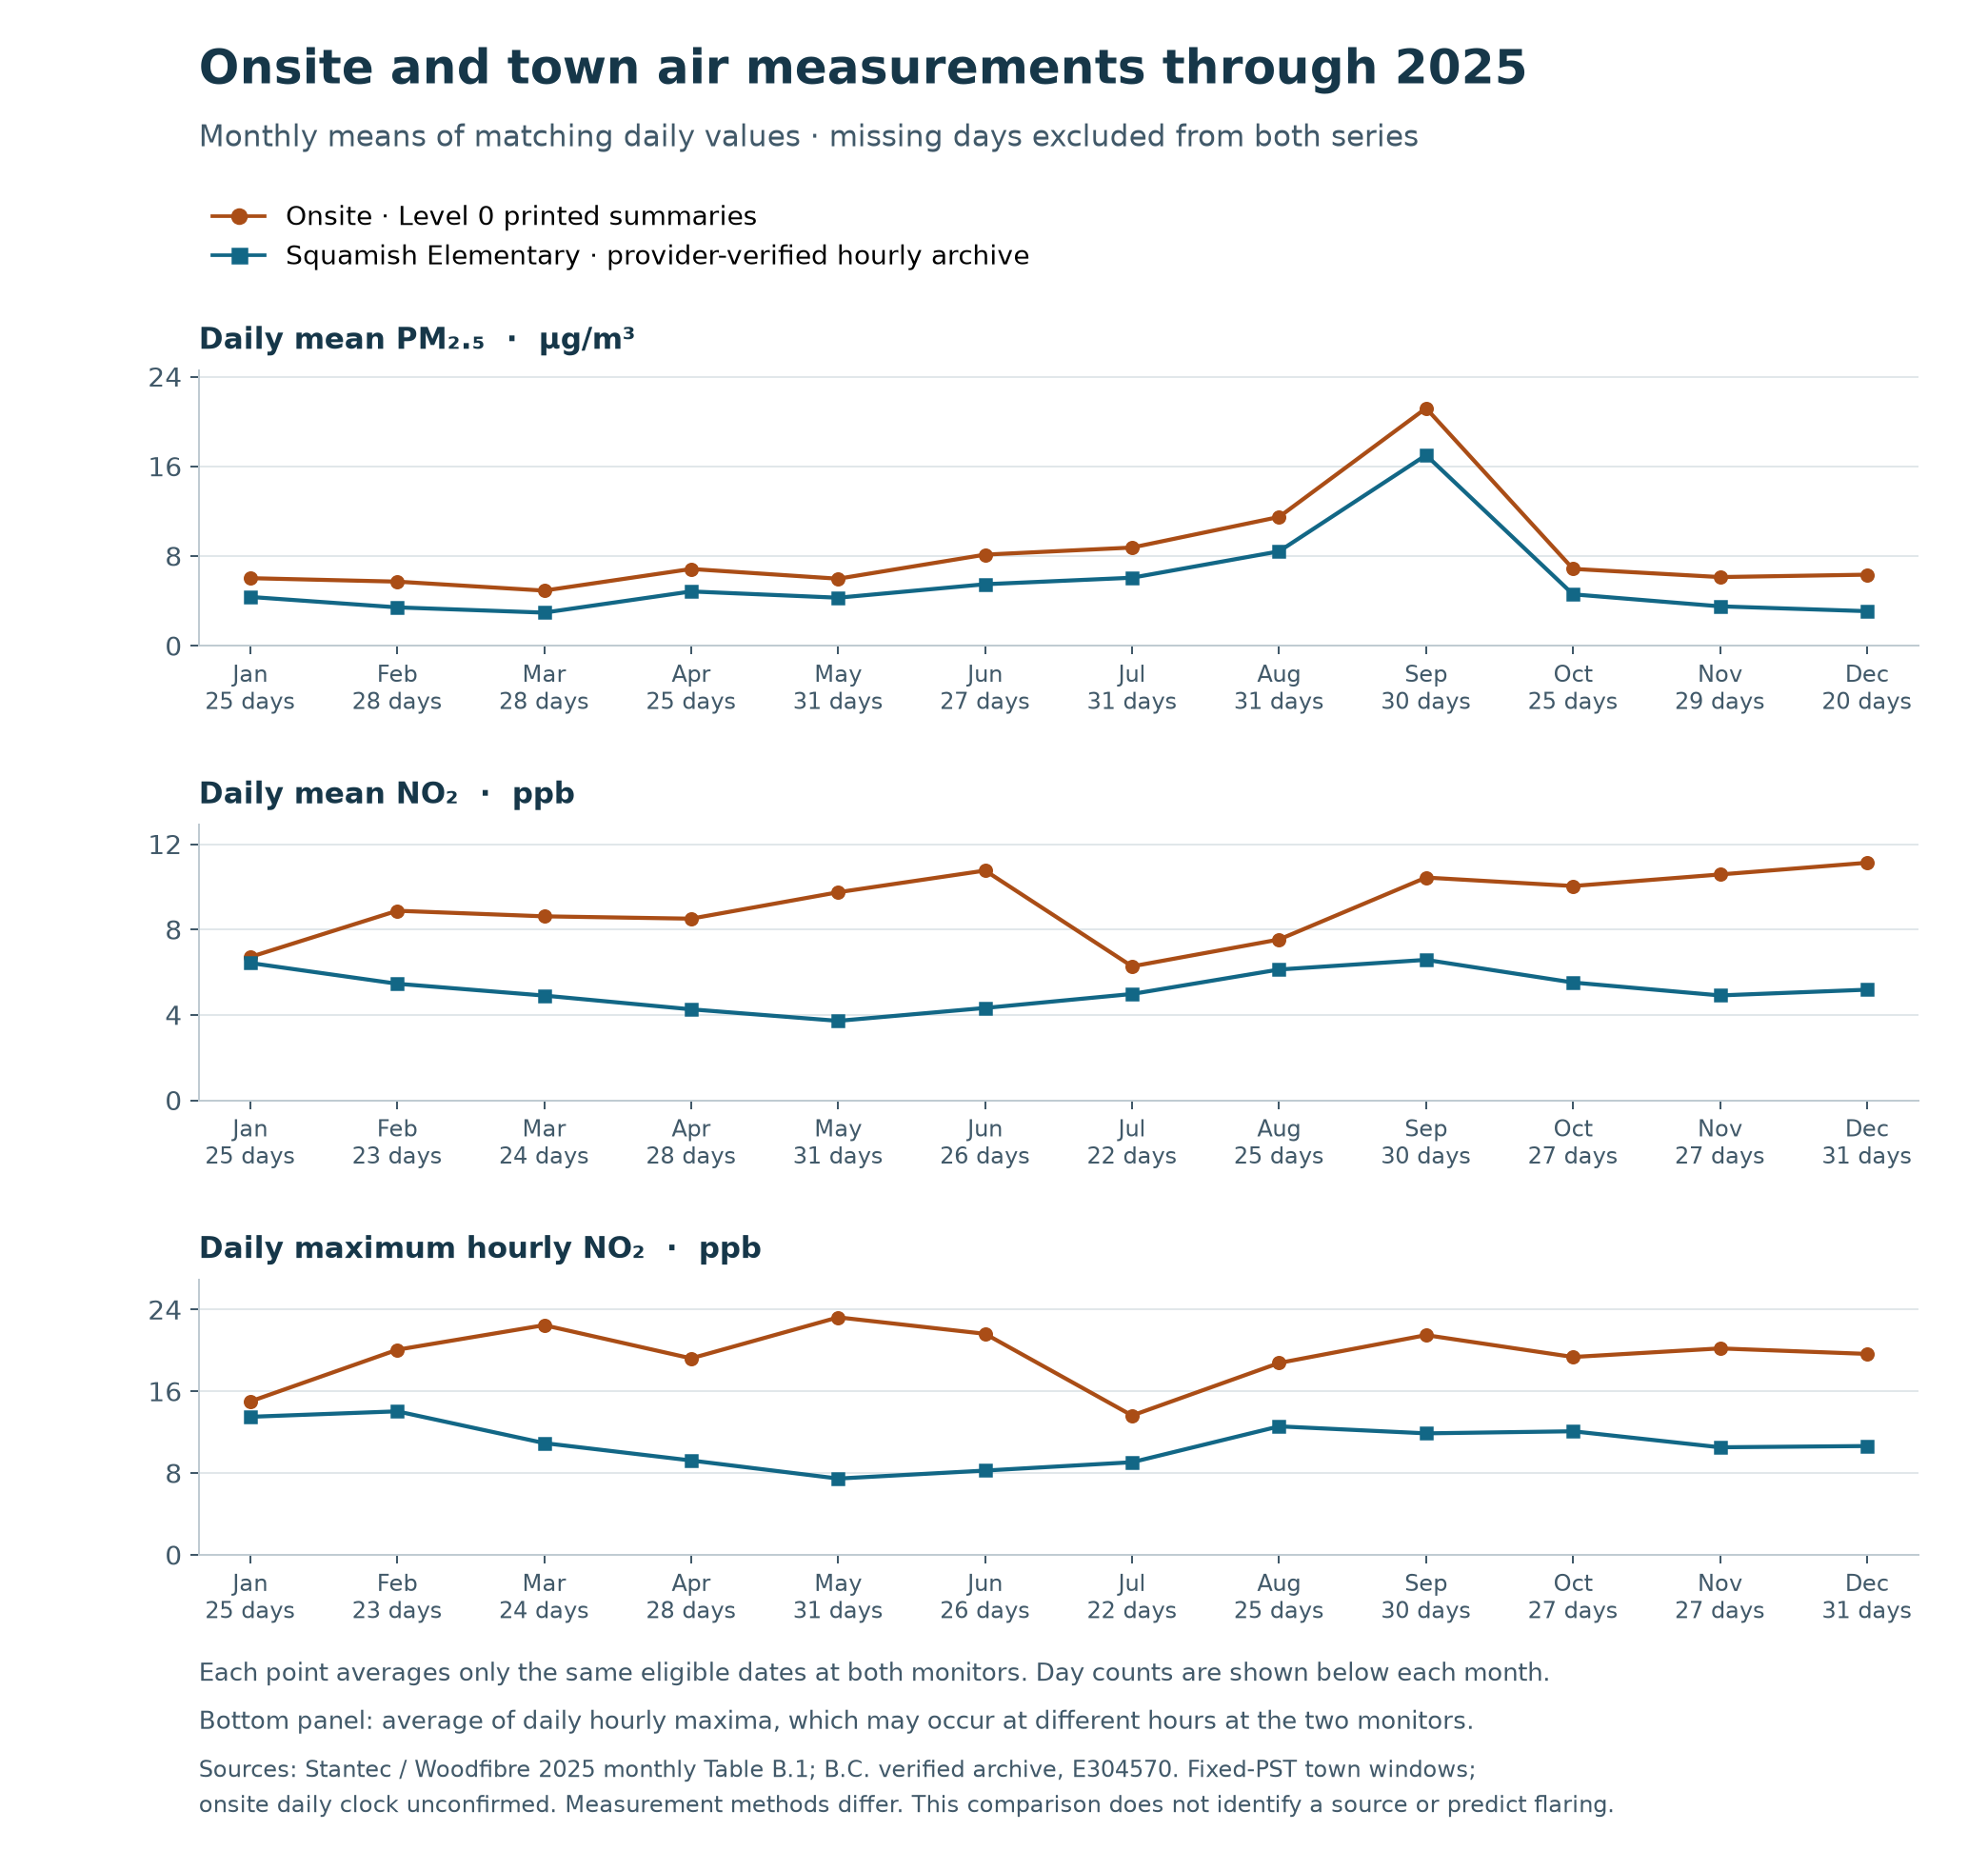
The published onsite and Squamish Elementary records show differences throughout 2025, with the size of the difference changing by month. Comparing the whole year gives a broader basis for assessing background air than the earlier May comparison.
Each plotted point averages the same eligible dates at both monitors. The onsite values come from Table B.1 of the twelve Stantec reports for Woodfibre; the town values are calculated from B.C.’s provider-verified hourly archive. The onsite reports label their air measurements Level 0 validation. Original monthly reports and transcribed tables, town archive and station context.
| Quantity | Paired dates out of 365 | Onsite mean of daily values | Town mean of daily values | Mean onsite-minus-town difference |
|---|---|---|---|---|
| Daily mean PM₂.₅, µg/m³ | 330 | 8.37 | 5.84 | +2.54 |
| Daily mean NO₂, ppb | 319 | 9.22 | 5.18 | +4.03 |
| Daily maximum hourly NO₂, ppb | 319 | 19.71 | 10.78 | +8.93 |
These are means of paired daily values, not complete hourly annual averages or B.C. objective-attainment statistics. The last row averages each day’s maximum hourly concentration; the two monitors’ daily peaks may occur at different hours.
The onsite monthly paired-day average was higher for all three quantities in each month. The NO₂ daily-mean difference ranged from about +0.28 ppb in January to +6.44 ppb in June. Both PM₂.₅ series had their highest monthly paired-day mean in September: onsite 21.18 µg/m³ and town 17.00 µg/m³. This comparison does not attribute those observations to flaring, construction, smoke or another source.
All 365 calendar dates remain in the results. A pair is eligible only when the onsite report prints a numeric value, all 24 expected town hourly records are available, and at least 18 contain numeric readings. Missing readings are not filled or converted to zero. The two station means always use the same dates. December’s PM₂.₅ comparison has only 20 paired dates because the town record has insufficient numeric hours on 11 dates; those omitted dates remain identifiable in the download.
The primary town day uses fixed PST, with native ending-hour records reconstructed into their hourly intervals. Onsite daily boundaries remain unconfirmed. Moving the town’s 24-hour window one hour earlier or later produces these results on dates eligible in all three windows:
| Quantity | Shared dates | Range of average onsite-minus-town differences | Largest individual town change from the primary window |
|---|---|---|---|
| Daily mean PM₂.₅, µg/m³ | 329 | +2.533 to +2.537 | 2.845 |
| Daily mean NO₂, ppb | 318 | +4.025 to +4.033 | 0.517 |
| Daily maximum hourly NO₂, ppb | 318 | +8.912 to +8.960 | 3.846 |
These are fixed-window timing checks, not confidence intervals or a reconstruction of daylight-saving days. The December 31 later window requires a January 1, 2026 hour outside the acquired verified archive, so that diagnostic is excluded. December 31’s primary comparison remains eligible. Provider-rounded town values were also checked separately; full-precision town values remain the primary calculation.
The month-to-month pattern supports examining local background conditions before applying the town station across the modelling area. It does not establish a source contribution or a correction factor. The monitors have different particle instruments, the onsite QA stage differs from the verified town archive, and onsite hourly completeness is unknown.
Published calibration appendices now identify the onsite BAM particle instruments and the November replacement of the NO₂ analyzer. These records help target a request for the correct hourly data and QA history. They do not establish the daily logger clock or final data validity. Instrument records and their limits.
The next priority is the final onsite hourly archive with quality flags, dated inlet and clock configuration, and concurrent weather and activity records. Those inputs would allow exact timing and a pollutant-specific background assessment. The daily comparison has not been applied as a map correction. Research and data priorities.
An independent reconstruction matched the paired values, eligibility decisions, monthly and annual summaries, timing checks and hourly source records: 1,497,995 checks, no discrepancies. All numeric comparisons were exact. The original May pairs also matched. This verifies the extraction and arithmetic; it does not certify the instruments or establish spatial representativeness.
Frozen calculation protocol · Method details · Daily paired records · Monthly and annual summaries · Full results · Checks · Analysis archive
The archive includes calculation code, native town records and onsite transcriptions. The twelve original third-party PDFs are linked external inputs; their hashes are checked by the calculation. The previously published May analysis and its frozen archive remain unchanged.