5 September 2026 · Observed case: 1–3 May 2025 · All local times below are fixed PST, UTC−8
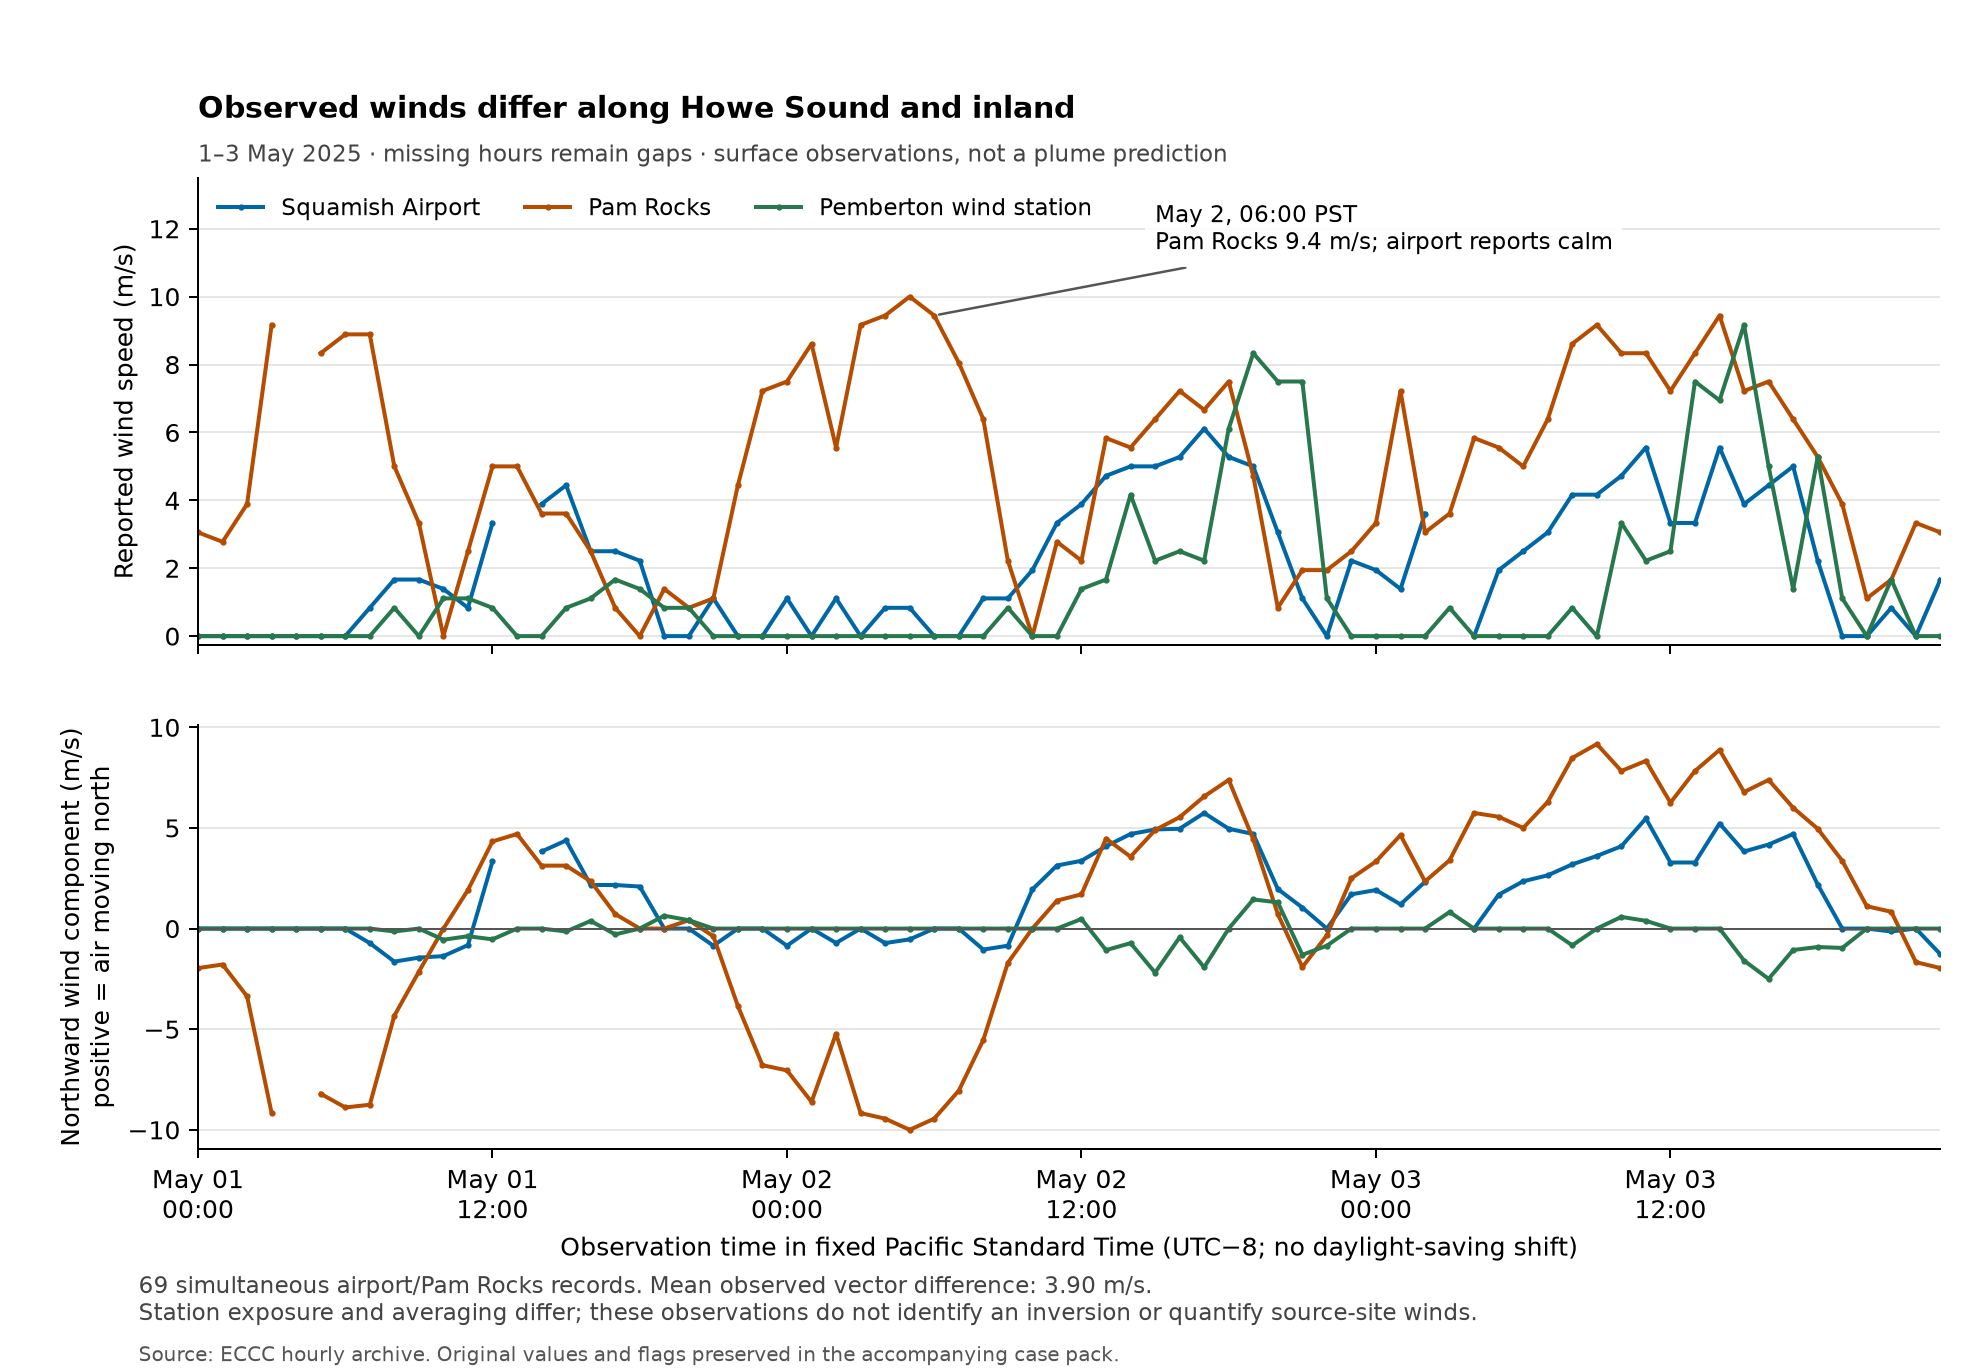
A single wind value cannot represent this whole corridor. In the acquired three-day sample, Squamish Airport and Pam Rocks often reported very different wind speeds at the same time. At 06:00 PST on 2 May, Pam Rocks reported 34 km/h (9.4 m/s) while the airport reported calm. Across 69 simultaneous records, the mean difference between the two wind vectors was 3.90 m/s. This is a difference between measured stations, not a model error or a measurement at Woodfibre.
The records support using and checking a spatially varying weather field. They do not establish that the air at the flare behaved like either station, or that an inversion occurred. Site exposure, instrument height and the measurement interval also matter. The northward component in the lower panel describes movement toward geographic north; it is not an automatic classification of flow along every bend of the valley.
| Data | Coverage and result | What remains missing |
|---|---|---|
| Squamish Airport | 70 of 72 expected observation timestamps; 20 reported calm | Two timestamps; flare-site representativeness; independently audited sensor history |
| Pam Rocks | 71 of 72 timestamps; three reported calm | One timestamp; flare-site representativeness; independently audited sensor history |
| Pemberton Airport wind station | 72 timestamps; 37 reported calm | Vertical profiles and evidence linking this inland station to source-level winds |
| Pemberton Airport CS | 72 temperature/pressure/humidity timestamps | Wind is absent in this retrieved series; absence is not a calm observation |
| Squamish Elementary air monitor | 24 hour-ending records per day for each of NO, NO₂, NOx, ozone, PM₂.₅ and SO₂; 432 records, 417 numeric | One missing numeric hour per day for each gas; no flare-event attribution or representative background distribution |
The provincial air data come from its verified annual archive, rather than a live provisional feed. “Verified” describes the provider's archive; it is not our independent certification of each instrument reading. Native values, units and missing entries are retained. Provincial archive catalogue, ECCC hourly climate collection
The air readings are hour-ending averages. A native record dated 3 May at 24:00 represents 23:00–24:00 on 3 May; its normalized end timestamp is 4 May at 00:00. Weather observations around the top of the hour have a different measurement interval. ECCC describes two-minute aviation wind averages and ten-minute MSC automatic-station averages before the observation time; the exact station configuration still needs confirmation. Matching the timestamp alone does not make these equal averaging periods. B.C. AQHI network review, §3.1, ECCC-authored observations paper, §2.1
The first air sample selected normalized timestamps from 1 May 00:00 through 3 May 23:00. That included the final hour of 30 April and omitted the final hour of 3 May. We preserved that original sample and made a corrected calendar-day version: six additional boundary records retrieved, 426 shared records reconfirmed exactly, with the original missing values still missing. The new processed file supplies both start and end times in UTC for all 432 air records. All 285 weather UTC/PST pairs and all 432 native air hour-ending labels passed consistency checks.
This prevents an avoidable one-hour alignment error. It does not supply the missing minute-level meteorology or make three days a representative baseline.
Nine simultaneous records had a reported airport calm while Pam Rocks was at least 5 m/s. Direction differences depend on how light winds are handled: requiring both stations to report at least 0.5, 1 or 2 m/s gives median angular separations of 30°, 20° and 15°, respectively. Those are analyst sensitivity cutoffs, not instrument limits. Calm directions remain undefined; missing observations are not filled in.
These are convenience-sample descriptions. We have not classified an inversion, reconstructed a flare event, attributed a pollution reading to Woodfibre, selected a background concentration, or assessed compliance from this sample. The next step is to compare actual forecast/reconstruction winds with observations over multiple independently selected episodes, then determine whether local downscaling and additional vertical measurements improve performance.
Processing checks establish traceability and consistent arithmetic; they do not validate atmospheric prediction.