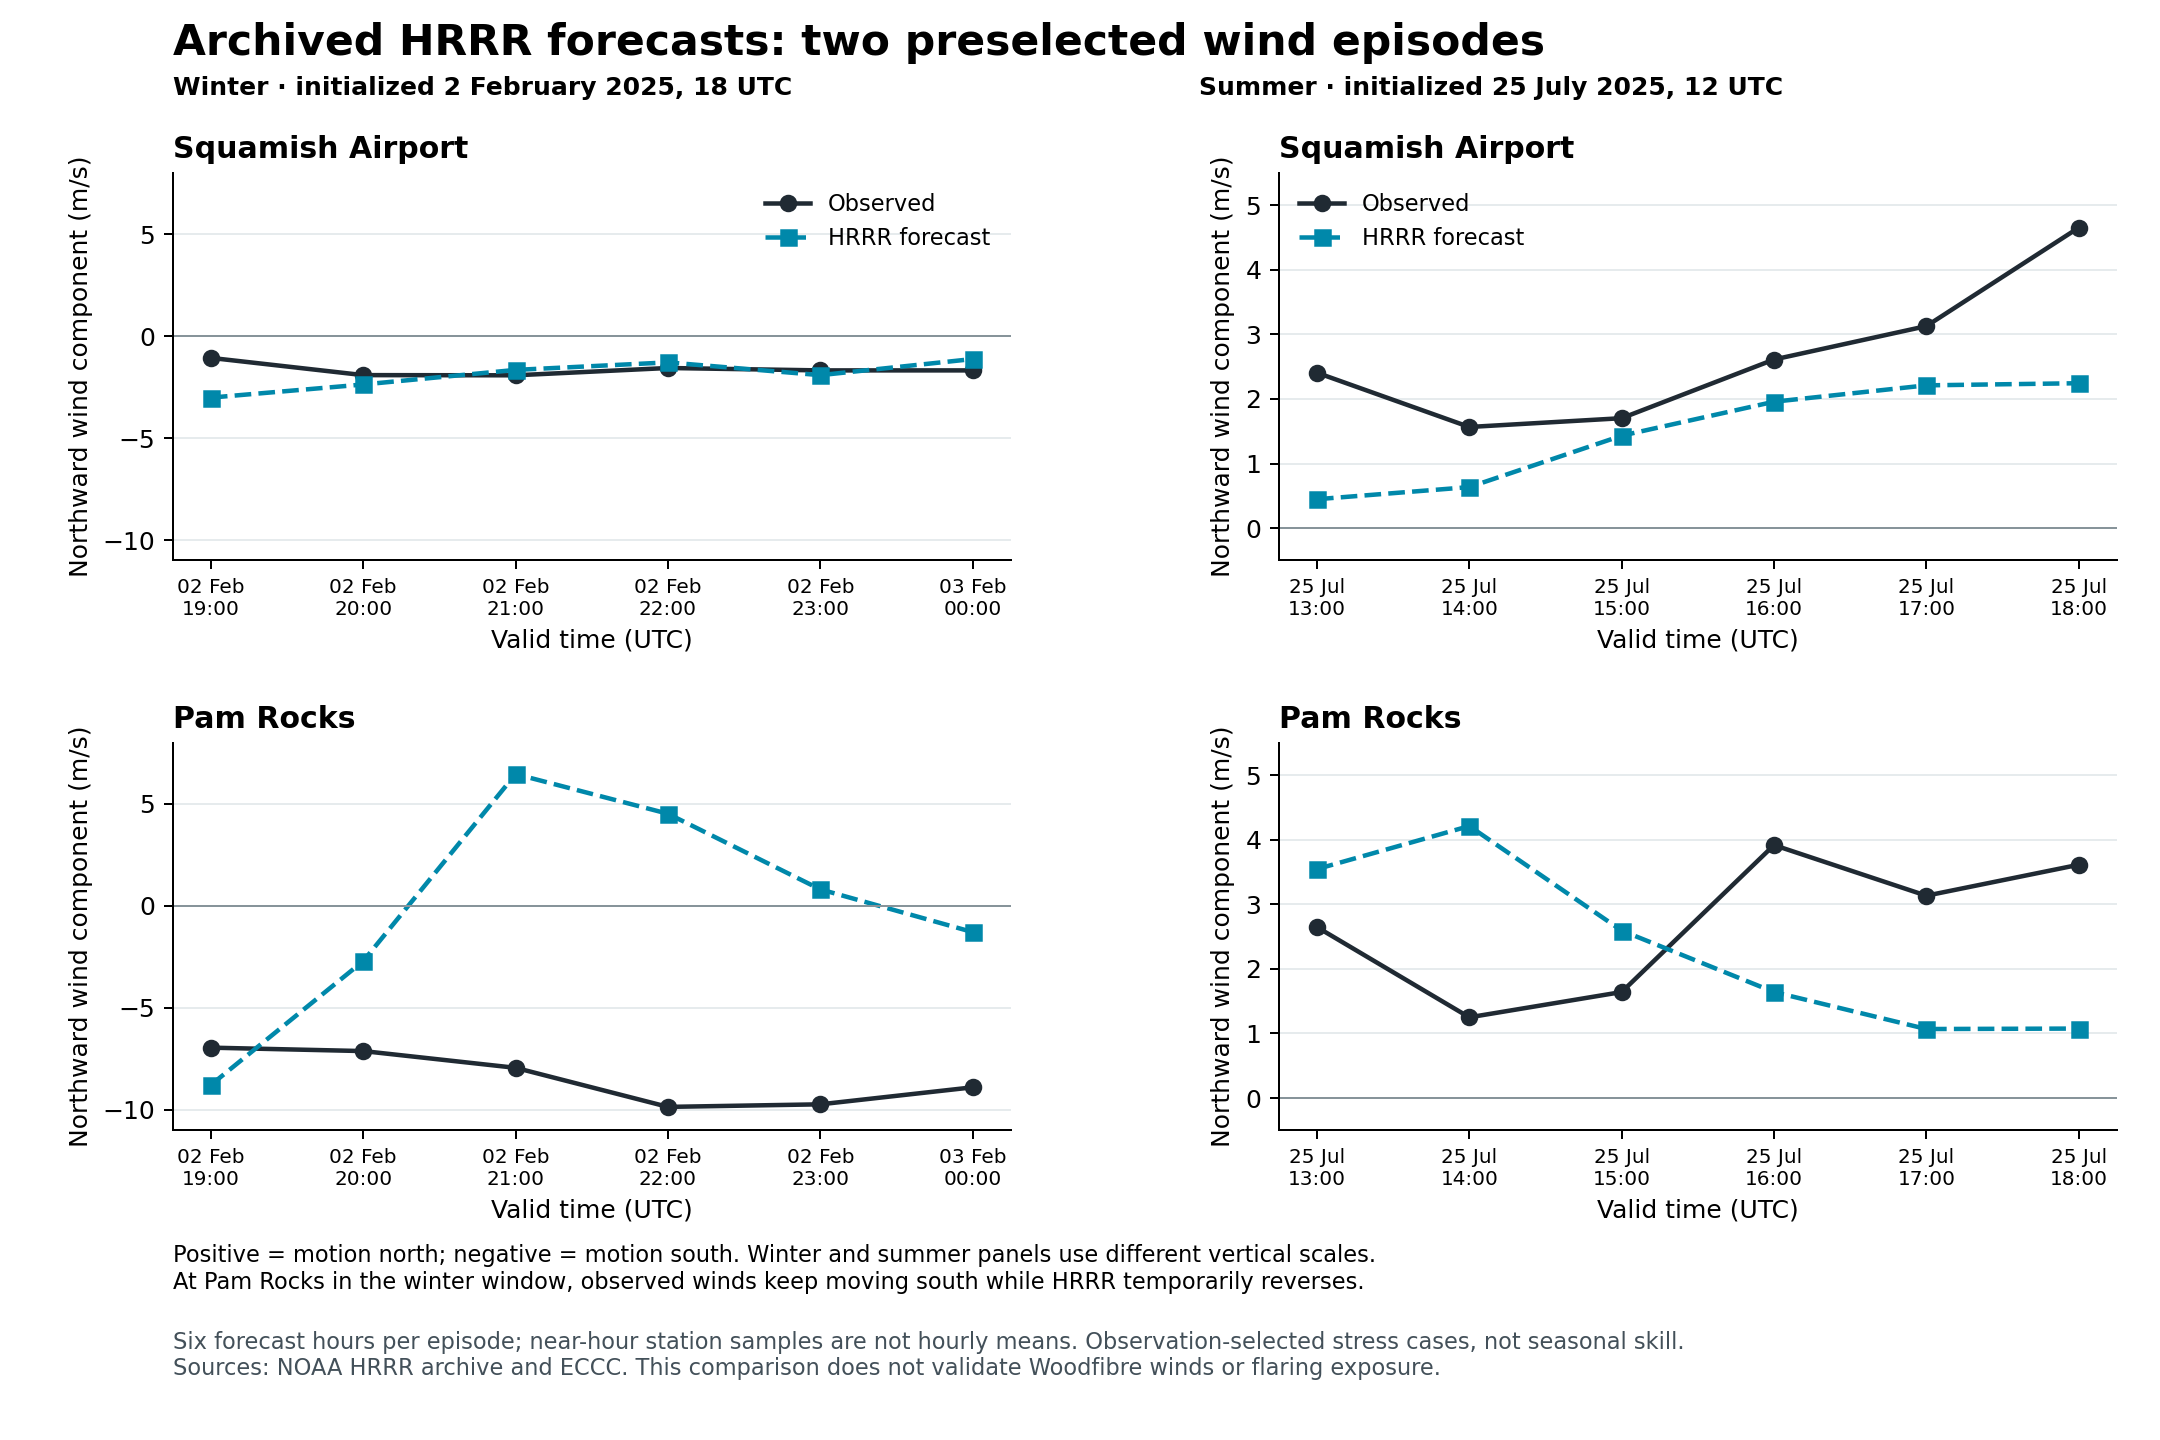
Public archived HRRR forecasts cover both preselected 2025 wind episodes and the Woodfibre–Squamish area. The winter test shows a major wind mismatch at Pam Rocks despite a small difference between model surface height and station elevation. These results establish an accessible forecast-testing route; they do not establish suitable Woodfibre dispersion forcing.
The dates were fixed before inspecting forecast errors. The winter initialization is 2 February 2025 at 18 UTC, with valid times 19 UTC through 3 February 00 UTC. The summer initialization is 25 July 2025 at 12 UTC, valid 13–18 UTC. Each is the first six-hourly cycle after the corresponding observation-selected run began. Six forecasts at each of two stations give 24 matched station-hours. The observations and forecasts remain separate sources of evidence.
| Episode | Station | Wind vector RMSE (m/s) | Wind speed MAE (m/s) | Direction MAE (degrees; eligible hours) | Temperature MAE (°C) |
|---|---|---|---|---|---|
| Winter | Squamish Airport | 2.636 | 0.598 | 70.0; 6 | 1.694 |
| Winter | Pam Rocks | 10.118 | 4.741 | 73.2; 5 | 1.065 |
| Summer | Squamish Airport | 1.776 | 0.578 | 32.4; 6 | 1.151 |
| Summer | Pam Rocks | 2.285 | 1.769 | 23.2; 6 | 0.408 |
All speed, vector and temperature metrics have six valid samples per row. Direction scoring requires both forecast and observed speed ≥1 m/s. Vector RMSE combines the error in eastward and northward wind; it captures direction errors that a speed-only comparison can miss.
During the winter window, Pam Rocks observations stay northerly, from 0–10°, at 6.94–10.0 m/s. HRRR turns to winds from about 152–184° at 21–23 UTC; its 23 UTC wind is only 0.82 m/s and is excluded from the direction score. This is a mismatch in these six hours at this station, not a diagnosis of the source-site wind or an entire fjord circulation. The summer errors are smaller in this selected test, but the two cases cannot establish seasonal skill. Do not compare these scores with the September 2026 HRDPS scores as a model ranking: the dates differ.
| Location | Nearest HRRR point, latitude / longitude | Distance (m) | Model surface height (m) | Observed/reference elevation (m) |
|---|---|---|---|---|
| Squamish Airport | 49.780731 / −123.171763 | 807 | 50.36 | 53.7 station metadata |
| Pam Rocks | 49.482805 / −123.294537 | 657 | 0.013 | 7.1 station metadata |
| Woodfibre map proxy | 49.657235 / −123.244574 | 1,128 | 38.26 | approximately 9, legacy terrain only |
Both dates have the same decoded 3 km Lambert grid: 1,799 × 1,059 points, tangent latitude 38.5°, central meridian −97.5°, spherical Earth radius 6,371,229 m. All three requested locations and all four corners of the 20 × 20 km display square are inside the grid. The closest projected domain edge is approximately 63 km from the airport and 74 km from the Woodfibre proxy. Coverage is necessary but does not guarantee reliable weather near a coast or model boundary.
The proxy is not a surveyed flare position or a weather station. Its nearest model point remains 1.1 km away and about 29 m above the approximate legacy shoreline elevation. Three other surrounding model terrain points are approximately 613–764 m high. This sharp terrain contrast shows why nearest-point choice, smoothing and unresolved shoreline flow matter. No elevation correction, interpolation, downscaling or fitted bias adjustment was applied.
The archive is NOAA's public noaa-hrrr-bdp-pds bucket. Exact dated surface and pressure-file listings and original .idx records were retrieved first. We preserved 56 original complete GRIB2 messages totalling 88,001,957 bytes, extracted by byte range rather than downloading entire forecast files. The records contain 10 m grid-relative U/V, 2 m temperature, native terrain, and 975/950 hPa U/V, temperature and geopotential height at lead six for both episodes, with corresponding surface pressure. All 12 pressure-level point records pass the pressure/height ground mask. These two-level forecast samples do not identify an observed inversion or validate vertical flow. NOAA archive access and attribution, NCEP HRRR product inventory.
Wind rotation uses each decoded Lambert longitude and the cone constant sin(38.5°), following the NOAA formula. It was checked using a separate inverse-projection/geodesic displacement and an independent reviewer's spherical Lambert equations. The largest projection-basis coefficient difference was 8.32 × 10⁻⁸. No instantaneous published direction field was available: the listed 10 m WIND field is an interval maximum and was neither downloaded nor substituted as an instantaneous magnitude check. NOAA HRRR wind-rotation instructions.
Original ECCC records were joined by explicit UTC, with fixed PST +8 hours verified. All 24 selected wind/temperature observations are present and have empty native quality flags; this does not establish final manual validation. Forecast fields are instantaneous and station winds are near-hour samples, with exact station-specific sampling intervals still unresolved. They are not full-hour means. The matched observations preserve native ECCC properties alongside normalized records. ECCC data licence.
The processing audit verifies all source hashes, byte ranges, GRIB internal lengths, 24 native-observation joins, four score groups and 12 ground masks. An independent law-of-cosines vector check differs by at most 3.55 × 10⁻¹⁵ m/s; direction means also agree with a vector-dot-product calculation. This establishes processing consistency, not atmospheric or dispersion validation.
Use the comparison table, point forecasts, limited profiles, full provenance and raw range/hash manifest for further investigation. Original indices, listings, messages and processing scripts are retained under work/hrrr-2025/; prior snapshots were not changed. NOAA and ECCC supplied the source data; this analysis is independent and does not imply their endorsement.