Historical flare screening: completed calculations and limits
5 September 2026
Forty isolated AERSCREEN calculations are complete: 36 source/surface/temperature cases, three longer-distance checks and one emission-scaling check. They use linked 2014–2015 flare heat and geometry with an independent 1 g/s passive tracer. They are sustained-source engineering sensitivities, not current emissions, a reconstruction of the original environmental-assessment runs, or a prediction for Squamish.
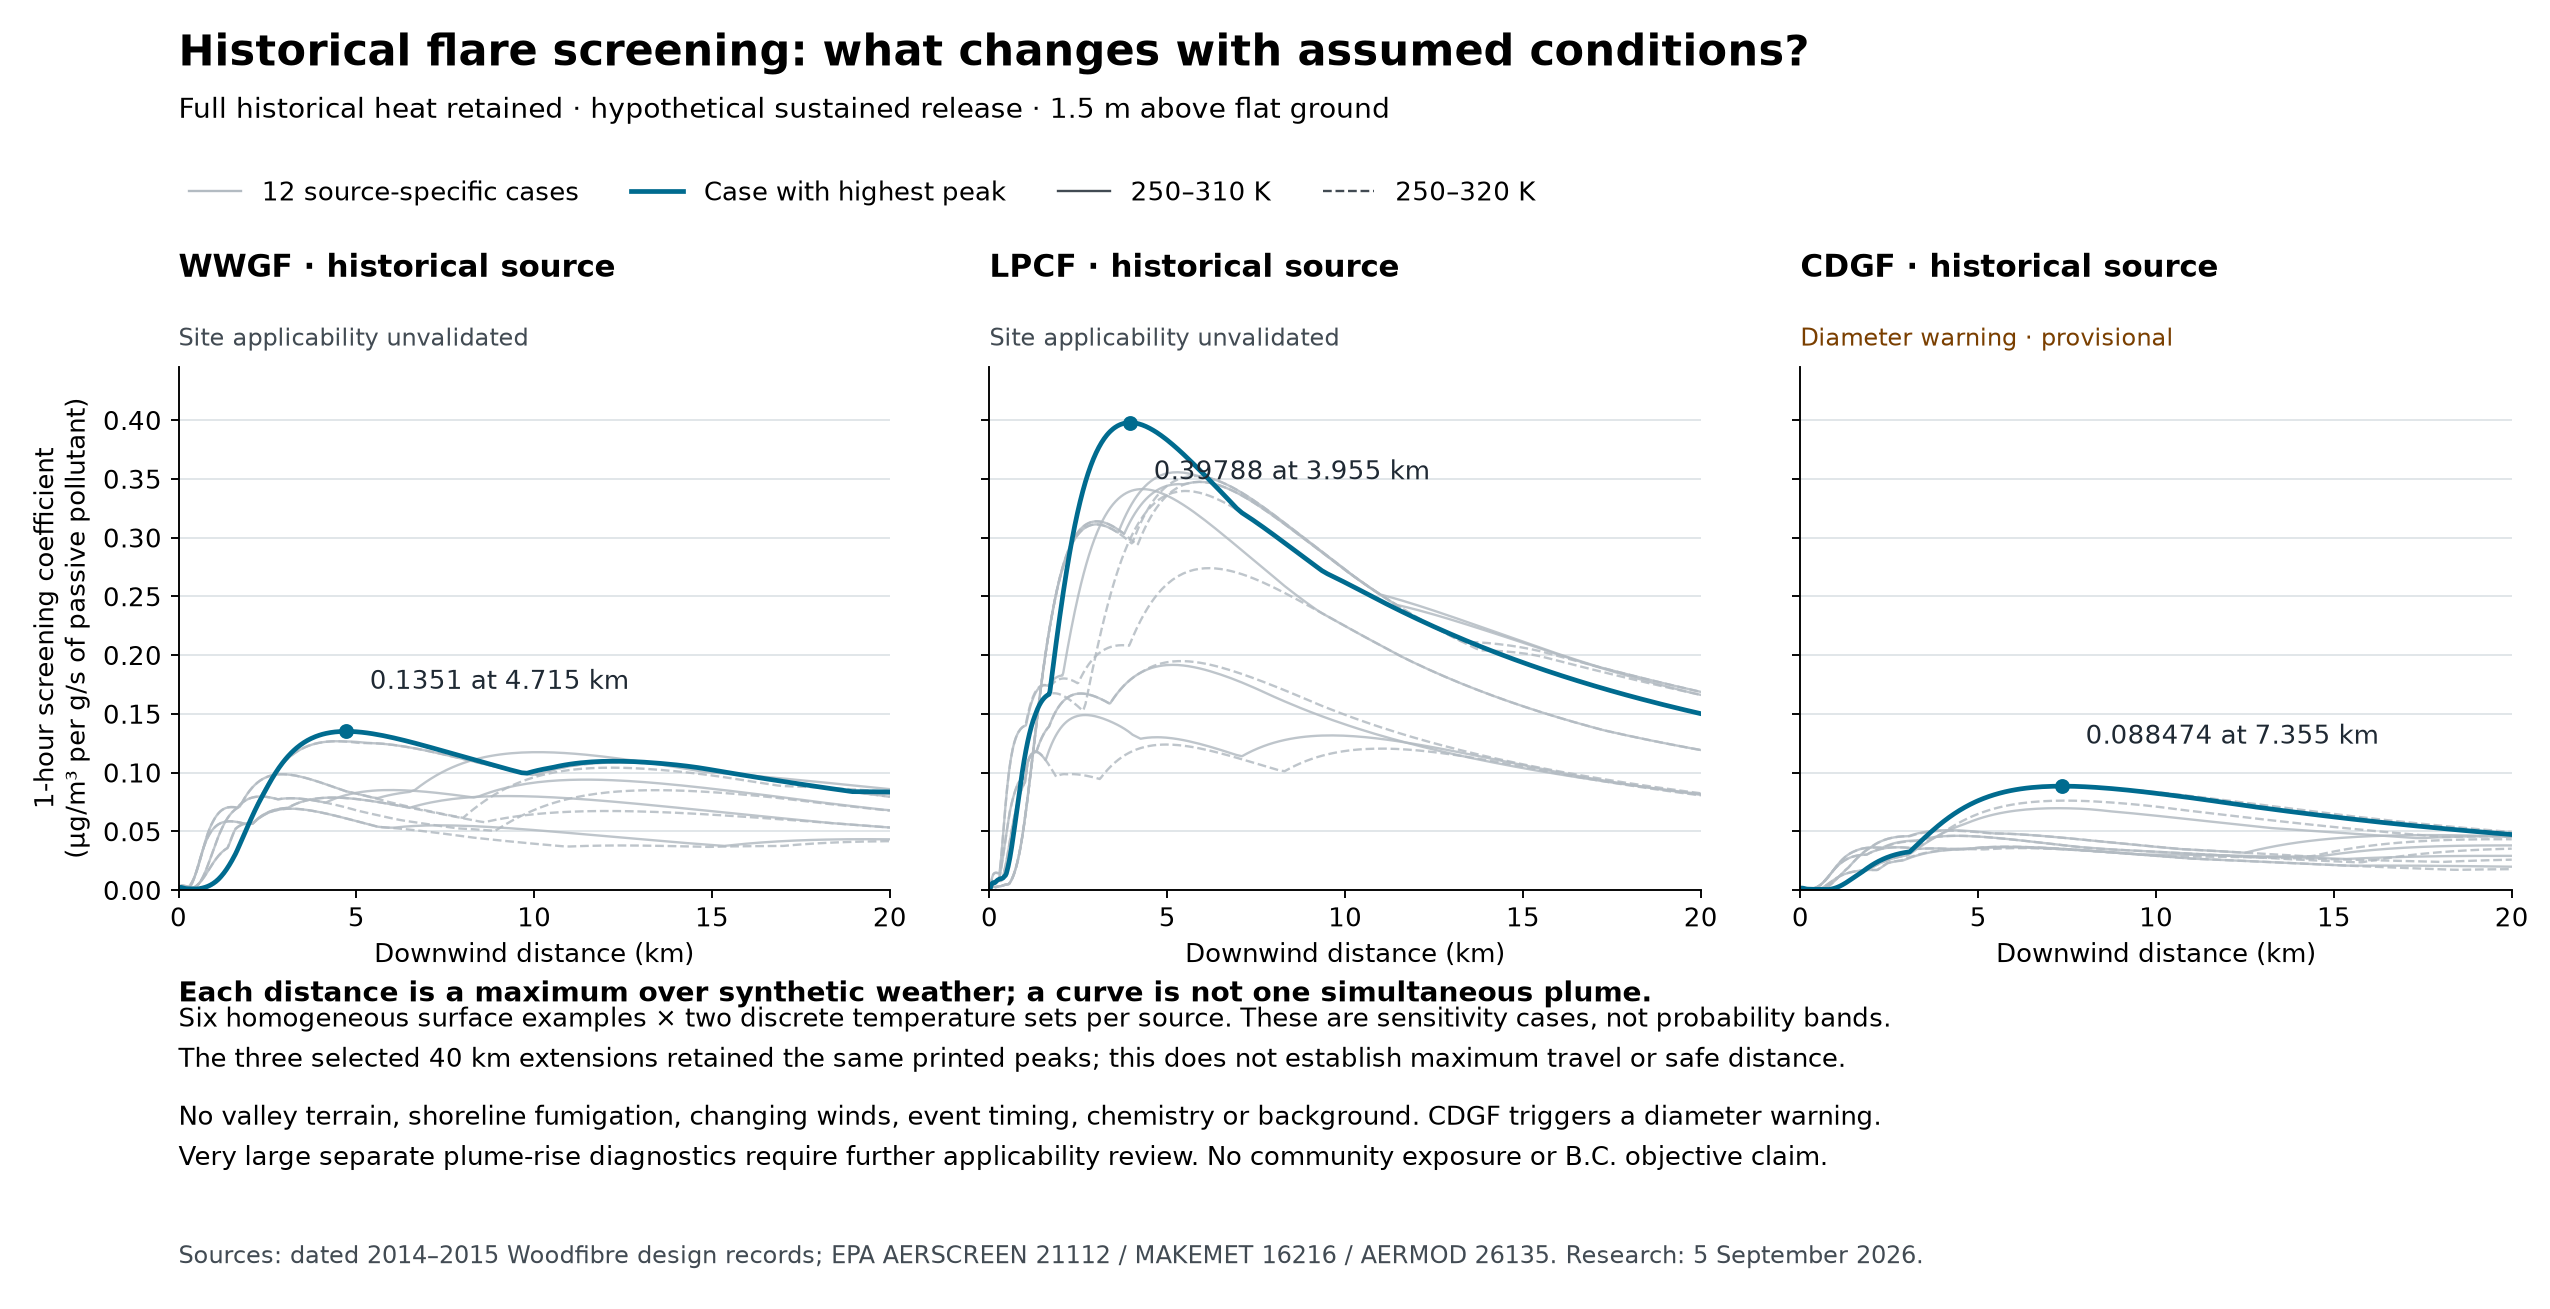
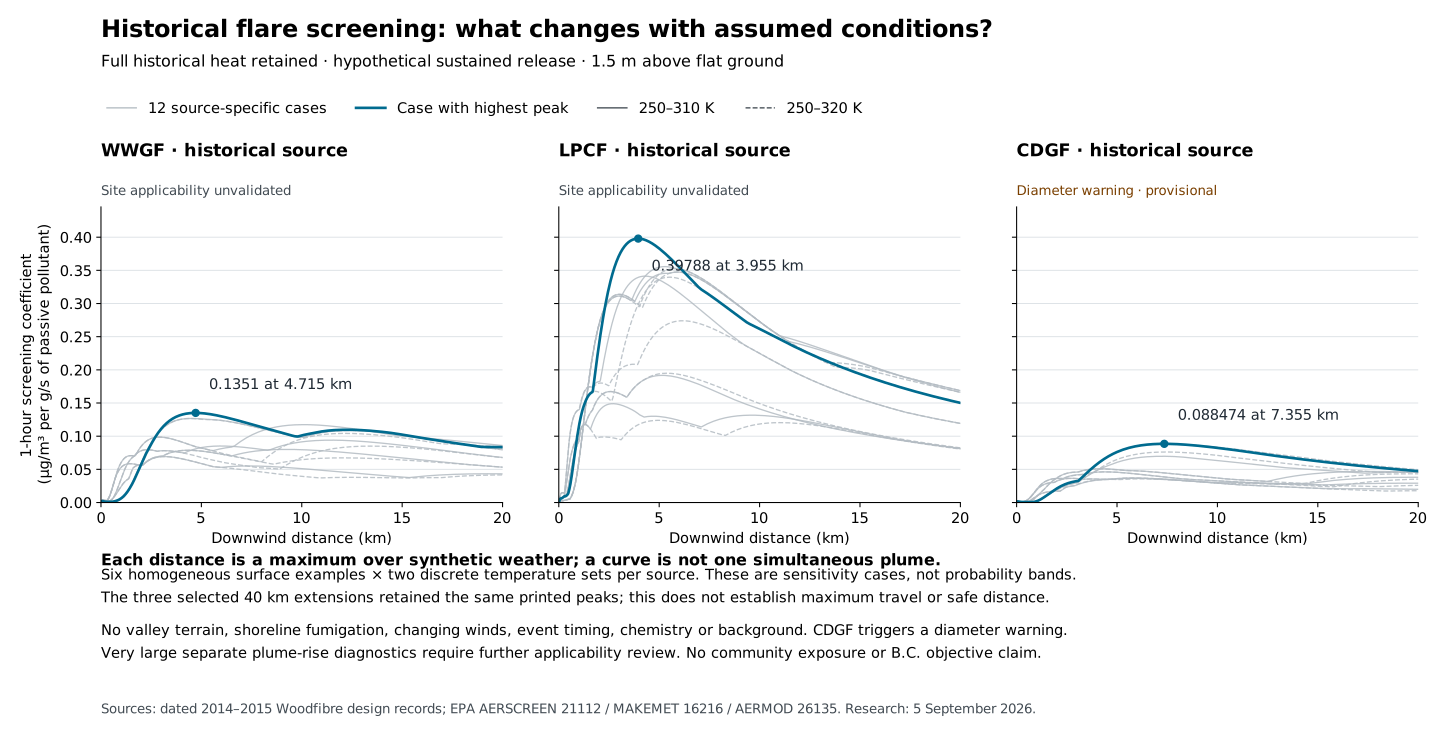
The initial 20 km calculations give the following range of case maxima. Units are (µg/m³)/(g/s) at a 1.5 m receptor above an arbitrary flat ground plane. The range is a small parameter sample, not an uncertainty interval or proven upper bound.
| Historical source | Lowest–highest case maximum | Refined distance of highest case | Highest case | Status |
|---|---|---|---|---|
| WWGF | 0.069304–0.13510 | 4,715 m | Water/autumn analogue, 250–310 K | No model warnings; site applicability unvalidated |
| LPCF | 0.12390–0.39788 | 3,955 m | Grass/autumn analogue, 250–310 K | No model warnings; site applicability unvalidated |
| CDGF | 0.035759–0.088474 | 7,355 m | Water/summer analogue, 250–310 K | Provisional: equivalent-diameter warning unresolved |
The screening curve figure, also available as an exportable SVG, shows all 36 initial curves with explicit applicability labels. Its independent check reconstructs all 40 generated source geometries using 40-digit decimal arithmetic and checks the 1.5 m receptor setting.
At each distance, the curve selects a maximum over different synthetic meteorology. Connecting its values does not describe a simultaneously occurring plume. A lower coefficient for the larger-heat CDGF case does not imply lower real emissions or lower real exposure: the mass rate is normalized independently of the retained heat, and model applicability remains unresolved.
The complete results contain all 40 explicit configurations, independent geometry checks, synthetic meteorological conditions at each distance, refined peak markers, diagnostics and runtime records. The combined curves contain 12,035 rows. The verification record supplies a compact audit and comparison summaries. The independent applicability review addresses the interpretation separately.
The inputs follow the reviewed screening basis and historical source audit: physical height 100 m; total heat 829,441,536, 214,146,240 and 2,235,346,960 cal/s for WWGF, LPCF and CDGF; radiative loss fraction 0.55; rural; no terrain, downwash, fumigation, deposition or chemistry. The 30 m computational start is not a recovered property boundary. The two temperature intervals, 250–310 K and 250–320 K, preserve both sets of discrete minimum/midpoint/maximum temperatures. Six manually specified surface analogues are used separately, with water roughness explicitly set to the model's 0.001 m floor. These are not a land-cover map or comprehensive weather envelope.
AERSCREEN receives physical height and full total heat, then derives equivalent source parameters. With heat Q in cal/s and loss fraction f, the checks use H = 100 + 0.00456Q^0.478 and D = 0.000988√[Q(1−f)], with equivalent temperature 1273 K and velocity 20 m/s. Reducing Q by the radiative loss before supplying f would count that loss twice. All 40 generated source records match the independent equations at their printed precision. EPA AERSCREEN guide, printed p14.
For the largest 20 km coefficient from each source, extending the search to 40 km found exactly the same printed peak and refined distance. The 215 common sampled distances in each pair also match within combined output precision. AERSCREEN changes outer probe spacing from 150 m to 350 m in these runs; the extension is therefore not a proof of uniform grid convergence. Every initial peak lies inside the search domain, but only the three selected cases were extended. Forty kilometres is neither a plume edge nor a safe-distance finding.
For WWGF's selected case, changing only tracer mass from 1 to 2 g/s preserved the full heat and geometry. All 301 distances match concentration doubling within the combined rounding tolerance: half of each printed resolution, with the original resolution multiplied by two. The maximum discrepancy from exact doubling is 0.00001 µg/m³; the peaks are 0.13510 and 0.27020 µg/m³ at 4,715 m. This checks passive mass scaling for this case. It does not check changes in fuel throughput, heat, combustion efficiency, chemistry or deposition. Longer-period AERSCREEN summaries are screening multipliers, not simulated 3-hour, 8-hour, 24-hour or annual event exposure.
Two material applicability issues remain visible. All 13 CDGF executions, including its extension, completed with AERMOD W320 for equivalent diameter DS = 31.335 m. The generic point-source check warns when DS > 20 m and retains the diameter; it is not a hard model rejection. No diameter was clipped. Correct reproduction of the prescribed flare equation does not establish model applicability at this scale. The remaining 27 executions completed without model warnings. Official AERMOD 26135 source archive, soset.f, lines 2872–2881.
AERSCREEN also prints very large final-rise diagnostics for highly buoyant sources under some low-wind synthetic conditions. For the selected maxima:
| Source | Synthetic wind at 10 m | Temperature | Convective mixing height | Printed final-rise diagnostic | Printed final-height diagnostic |
|---|---|---|---|---|---|
| WWGF | 1.0 m/s | 250 K | 520 m | 8,956.0 m | 9,139.6 m |
| LPCF | 0.5 m/s | 280 K | 437 m | 9,124.4 m | 9,268.2 m |
| CDGF | 0.5 m/s | 250 K | 989 m | 39,287.2 m | 39,521.5 m |
These are not credible demonstrated Howe Sound plume heights and must not be drawn as plume trajectories. AERSCREEN calculates this reporting diagnostic separately after selecting the maximum. Its unstable, below-mixing-height branch does not apply the stable final-rise cap. The actual AERMOD source inputs remain the equivalent heights of 183.588, 143.757 and 234.262 m. AERMOD separately computes inversion penetration and contributions from a penetrated plume; the huge reporting number is not its complete concentration calculation. No penetration fraction was independently extracted from these runs, and no local inversion or plume observation validates that treatment here. Official AERSCREEN source, AERSCREEN.FOR lines 13056–13064 and 13774–13898; official AERMOD source, calc1.f lines 7091–7181 and prise.f CBLPR3.
The generated matrices contain 516–701 synthetic records per source/surface/temperature case. They retain the requested 0.5 m/s wind floor, 10 m reference height, unadjusted friction velocity and exact manual surface tuples. Their artificial dates, placeholder geographic headers and constructed downwind direction have no observed Squamish meaning. The discrete stable and convective candidate wind sets reach 18 and 10 m/s respectively; they are not all physical wind bounds. Strong observed Pam Rocks winds can exceed the matrix.
The calculations used the previously reproduced official flare reference pathway: AERSCREEN 21112, MAKEMET 16216 and AERMOD 26135. No scientific source or model binary changed. The preserved adaptations remain prompt-format compatibility, local command aliases and the restricted copy/clear adapters described in that readiness record. Each run has its own copied, hash-checked binaries, initial input, exact configuration, command/stdin record, logs, meteorological files and outputs under work/historical-screening/runs/. The initial full-precision heat inputs are preserved separately because regenerated report headers round heat.
Summed model execution time was 97.88 seconds; the 36-case matrix orchestration took 28.84 seconds using three independent working folders at a time. Results use AERSCREEN's explicit refined-peak asterisk, rather than the first distance on a rounded concentration plateau. All requested calculations and limited numerical checks are complete. Terrain/coastal flow, historical event timing, combustion/speciation and highly buoyant plume applicability remain separate requirements before these results can inform a defensible local exposure prediction.
The frozen evidence package preserves all 40 run records, source/temperature evidence, reviewed results, figures and scripts. Its manifest inventories the payload, and the separate archive check records the ZIP hash, CRC and every member's verified hash. Compiled software is excluded; the prediction foundations package supplies the companion source/build/reference prerequisite.