5 September 2026 · Research update
Two additional road-weather stations and B.C.’s regional weather archive provide new inputs for testing how winds move through Howe Sound. The provincial files include temperature and wind with height, a necessary step toward representing elevated flare plumes and inversions. Their suitability at the shoreline still needs evaluation.
The B.C. Weather Archive provides 2025 records for Tantalus, north of Squamish, and Eagle Ridge, near the southern approach to Howe Sound. Each downloaded annual file contains 8,756 records with numeric wind-speed and direction fields. January’s separately downloaded records match the corresponding annual fields exactly. The Porteau Cove file contains weather observations but has blank wind fields throughout 2025.
The archive describes wind as a vector average over the preceding hour, with speed in kilometres per hour. Its current public documentation does not settle the observation clock, daylight-time handling or whether the stored direction is wind-from or wind-to. All three annual exports omit the same four calendar labels around the March and November clock-change dates. We have preserved these gaps without assigning a cause or filling them. The official archive code preserves the stored monthly values; it does not resolve how those values were originally timestamped.
Both wind stations also have 720 records with numeric wind fields in June 2023, overlapping the available regional-model period. These are potential comparison inputs once their time and instrument metadata are established. Numeric availability alone does not establish measurement quality.
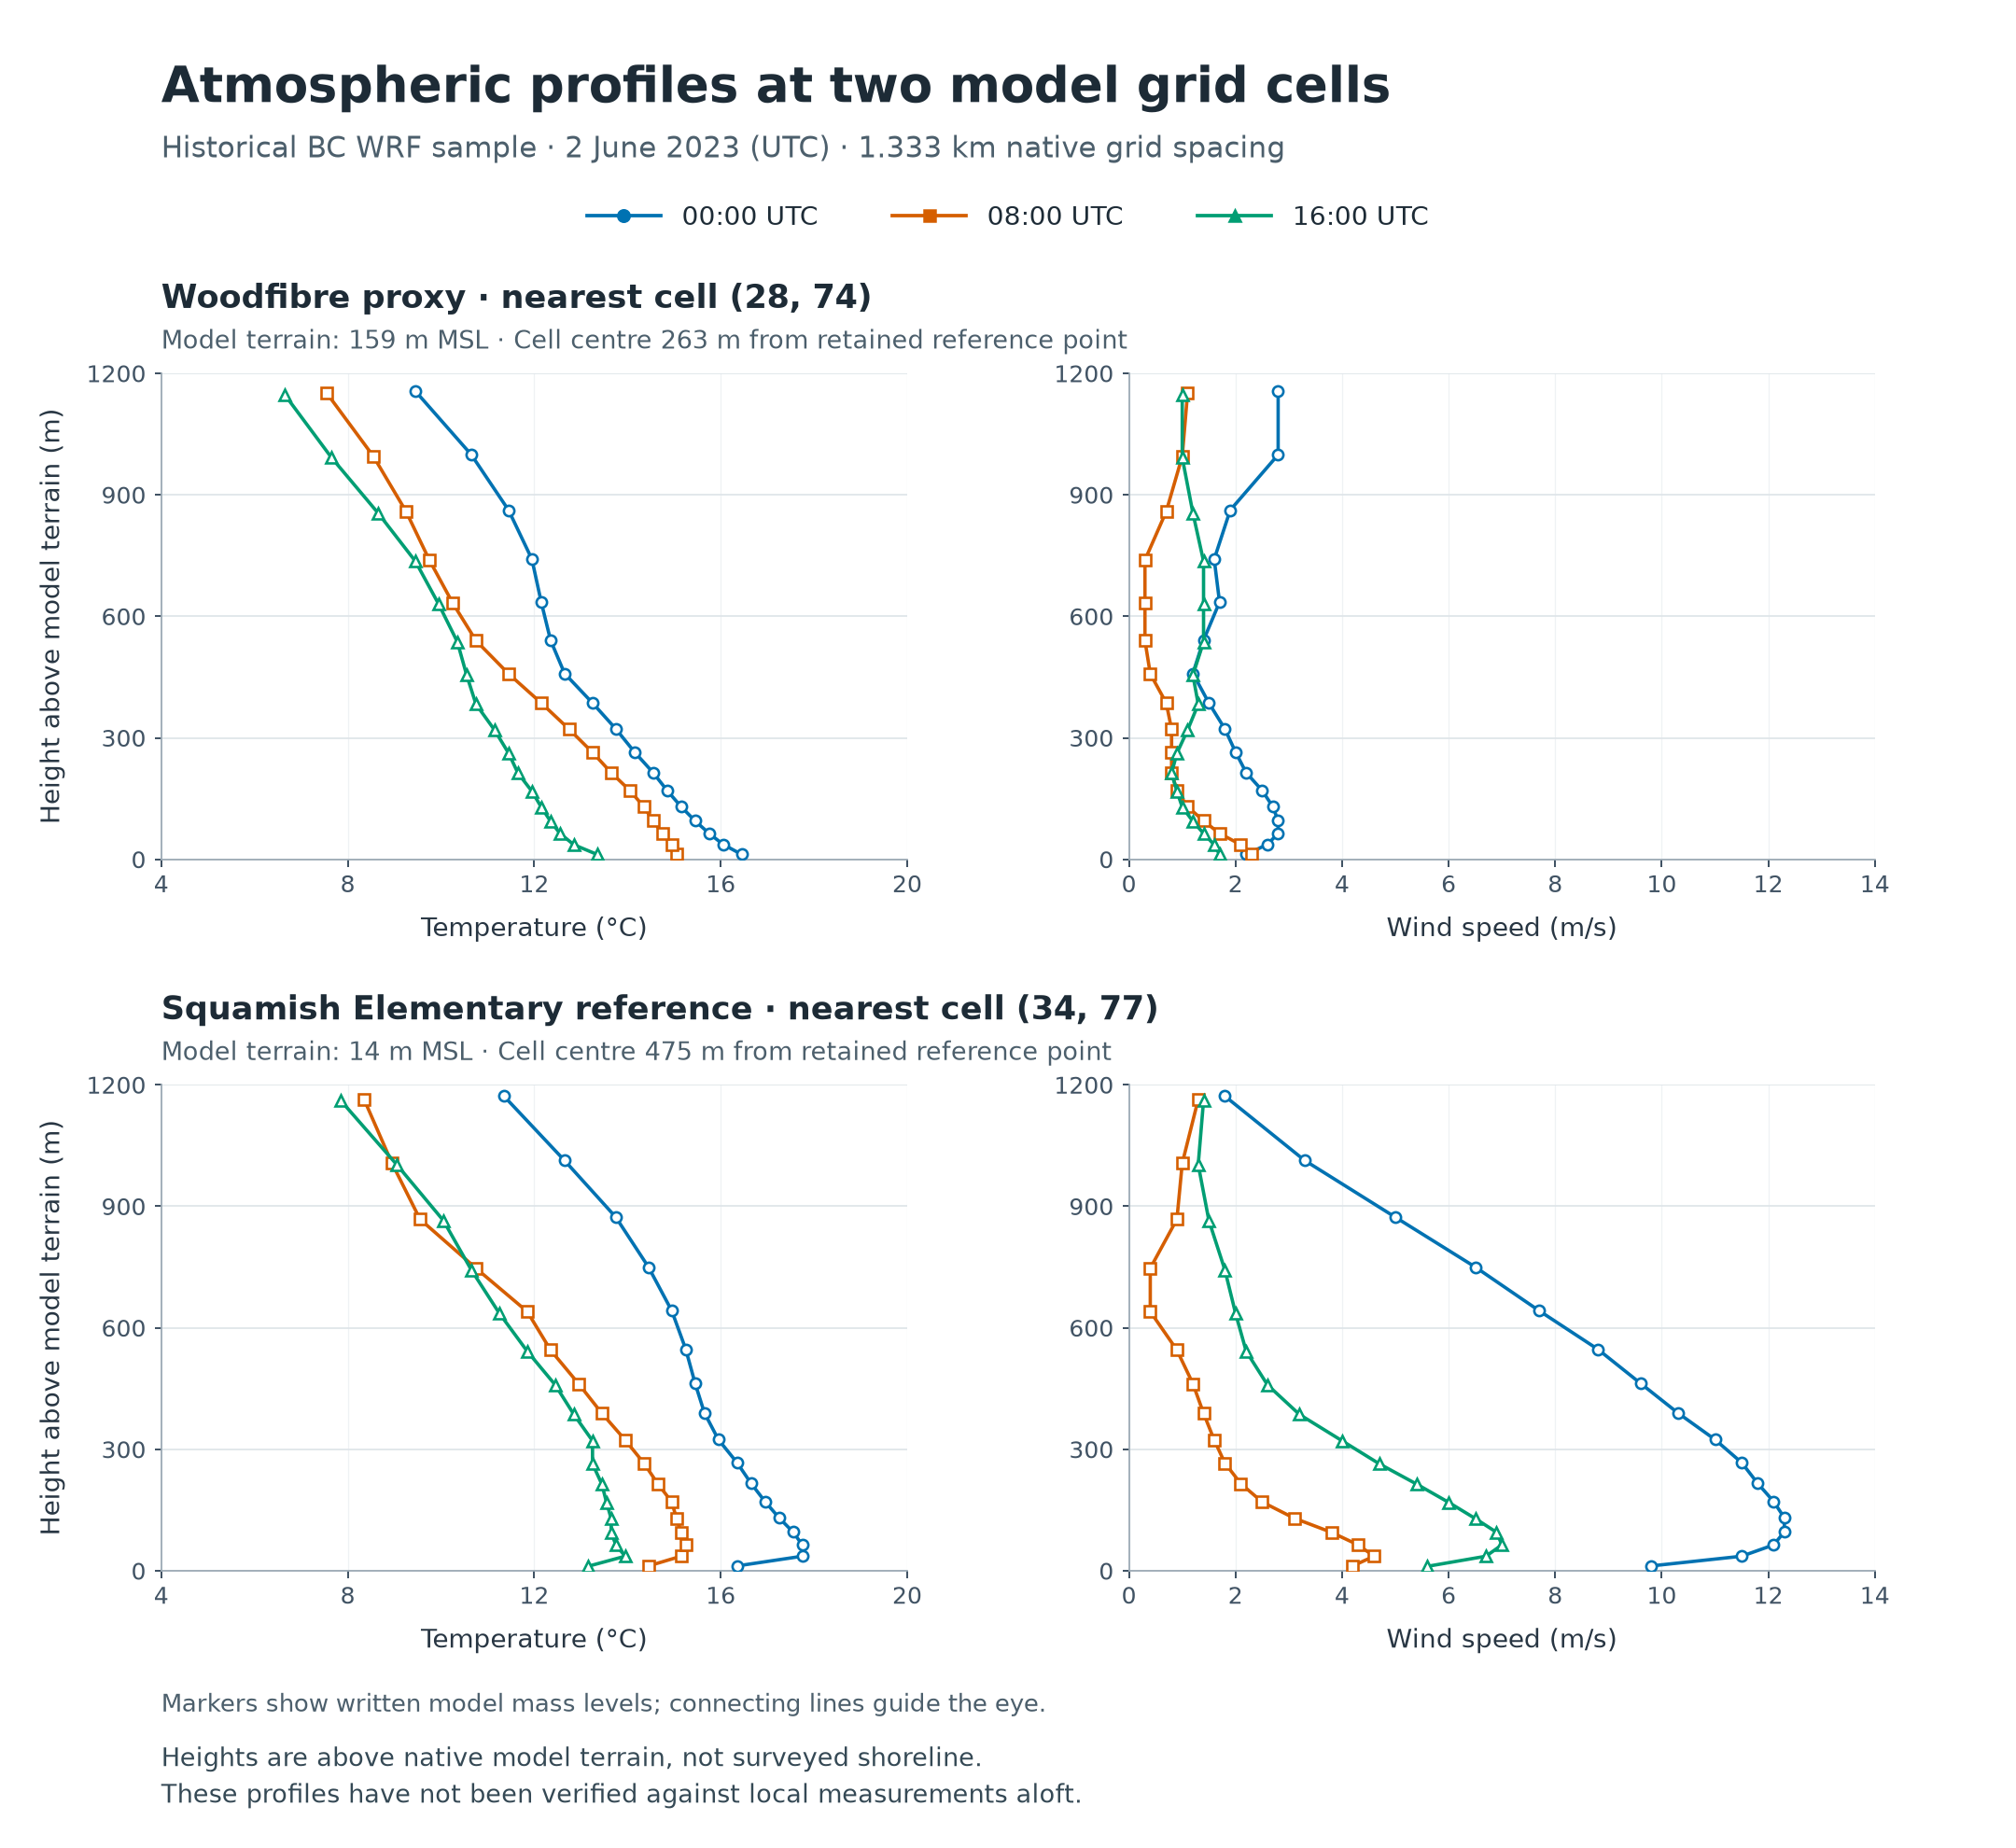
The provincial WRF service successfully generated a small download package for the Howe Sound corridor. Its returned file list selects the d06 regional grid at 1.333 km spacing. The native headers identify WRF 4.6.0, CALWRF 2.0.3 and 40 vertical levels.
We inspected the headers of 18 surrounding tiles and downloaded two complete tiles covering Woodfibre and central Squamish. Each complete file contains 733 consecutive hourly records, from June 1 through July 1 at noon UTC, including the June 2 sample day. An independent reader matched every hourly boundary and the extracted records. The two full tiles contain 200 horizontal grid points; the surrounding headers describe 1,800 points. Header inspection is not equivalent to downloading the surrounding weather records.
The sample day is an access and format check. It was chosen before examining model performance and is not an identified inversion or outflow event. The original files are retained, and the sample records remain separate from the website’s illustrative concentration calculation.
The model ground at the nearest Woodfibre proxy point is 159 m above mean sea level, and the grid centre is about 263 m from the proxy. At the grid point nearest Squamish Elementary, those values are 14 m and about 475 m. A profile height above this model ground is not a height above the surveyed shoreline or monitor. The source proxy itself is a published operations-control-tower location, not a surveyed flare tip.
Profile data and interpretation · All 24 hours of profiles · Surface fields
These inputs improve the basis for meteorological testing. Current flare-release information, evaluated local transport, chemistry and appropriate background concentrations are still needed for facility-specific concentration predictions.