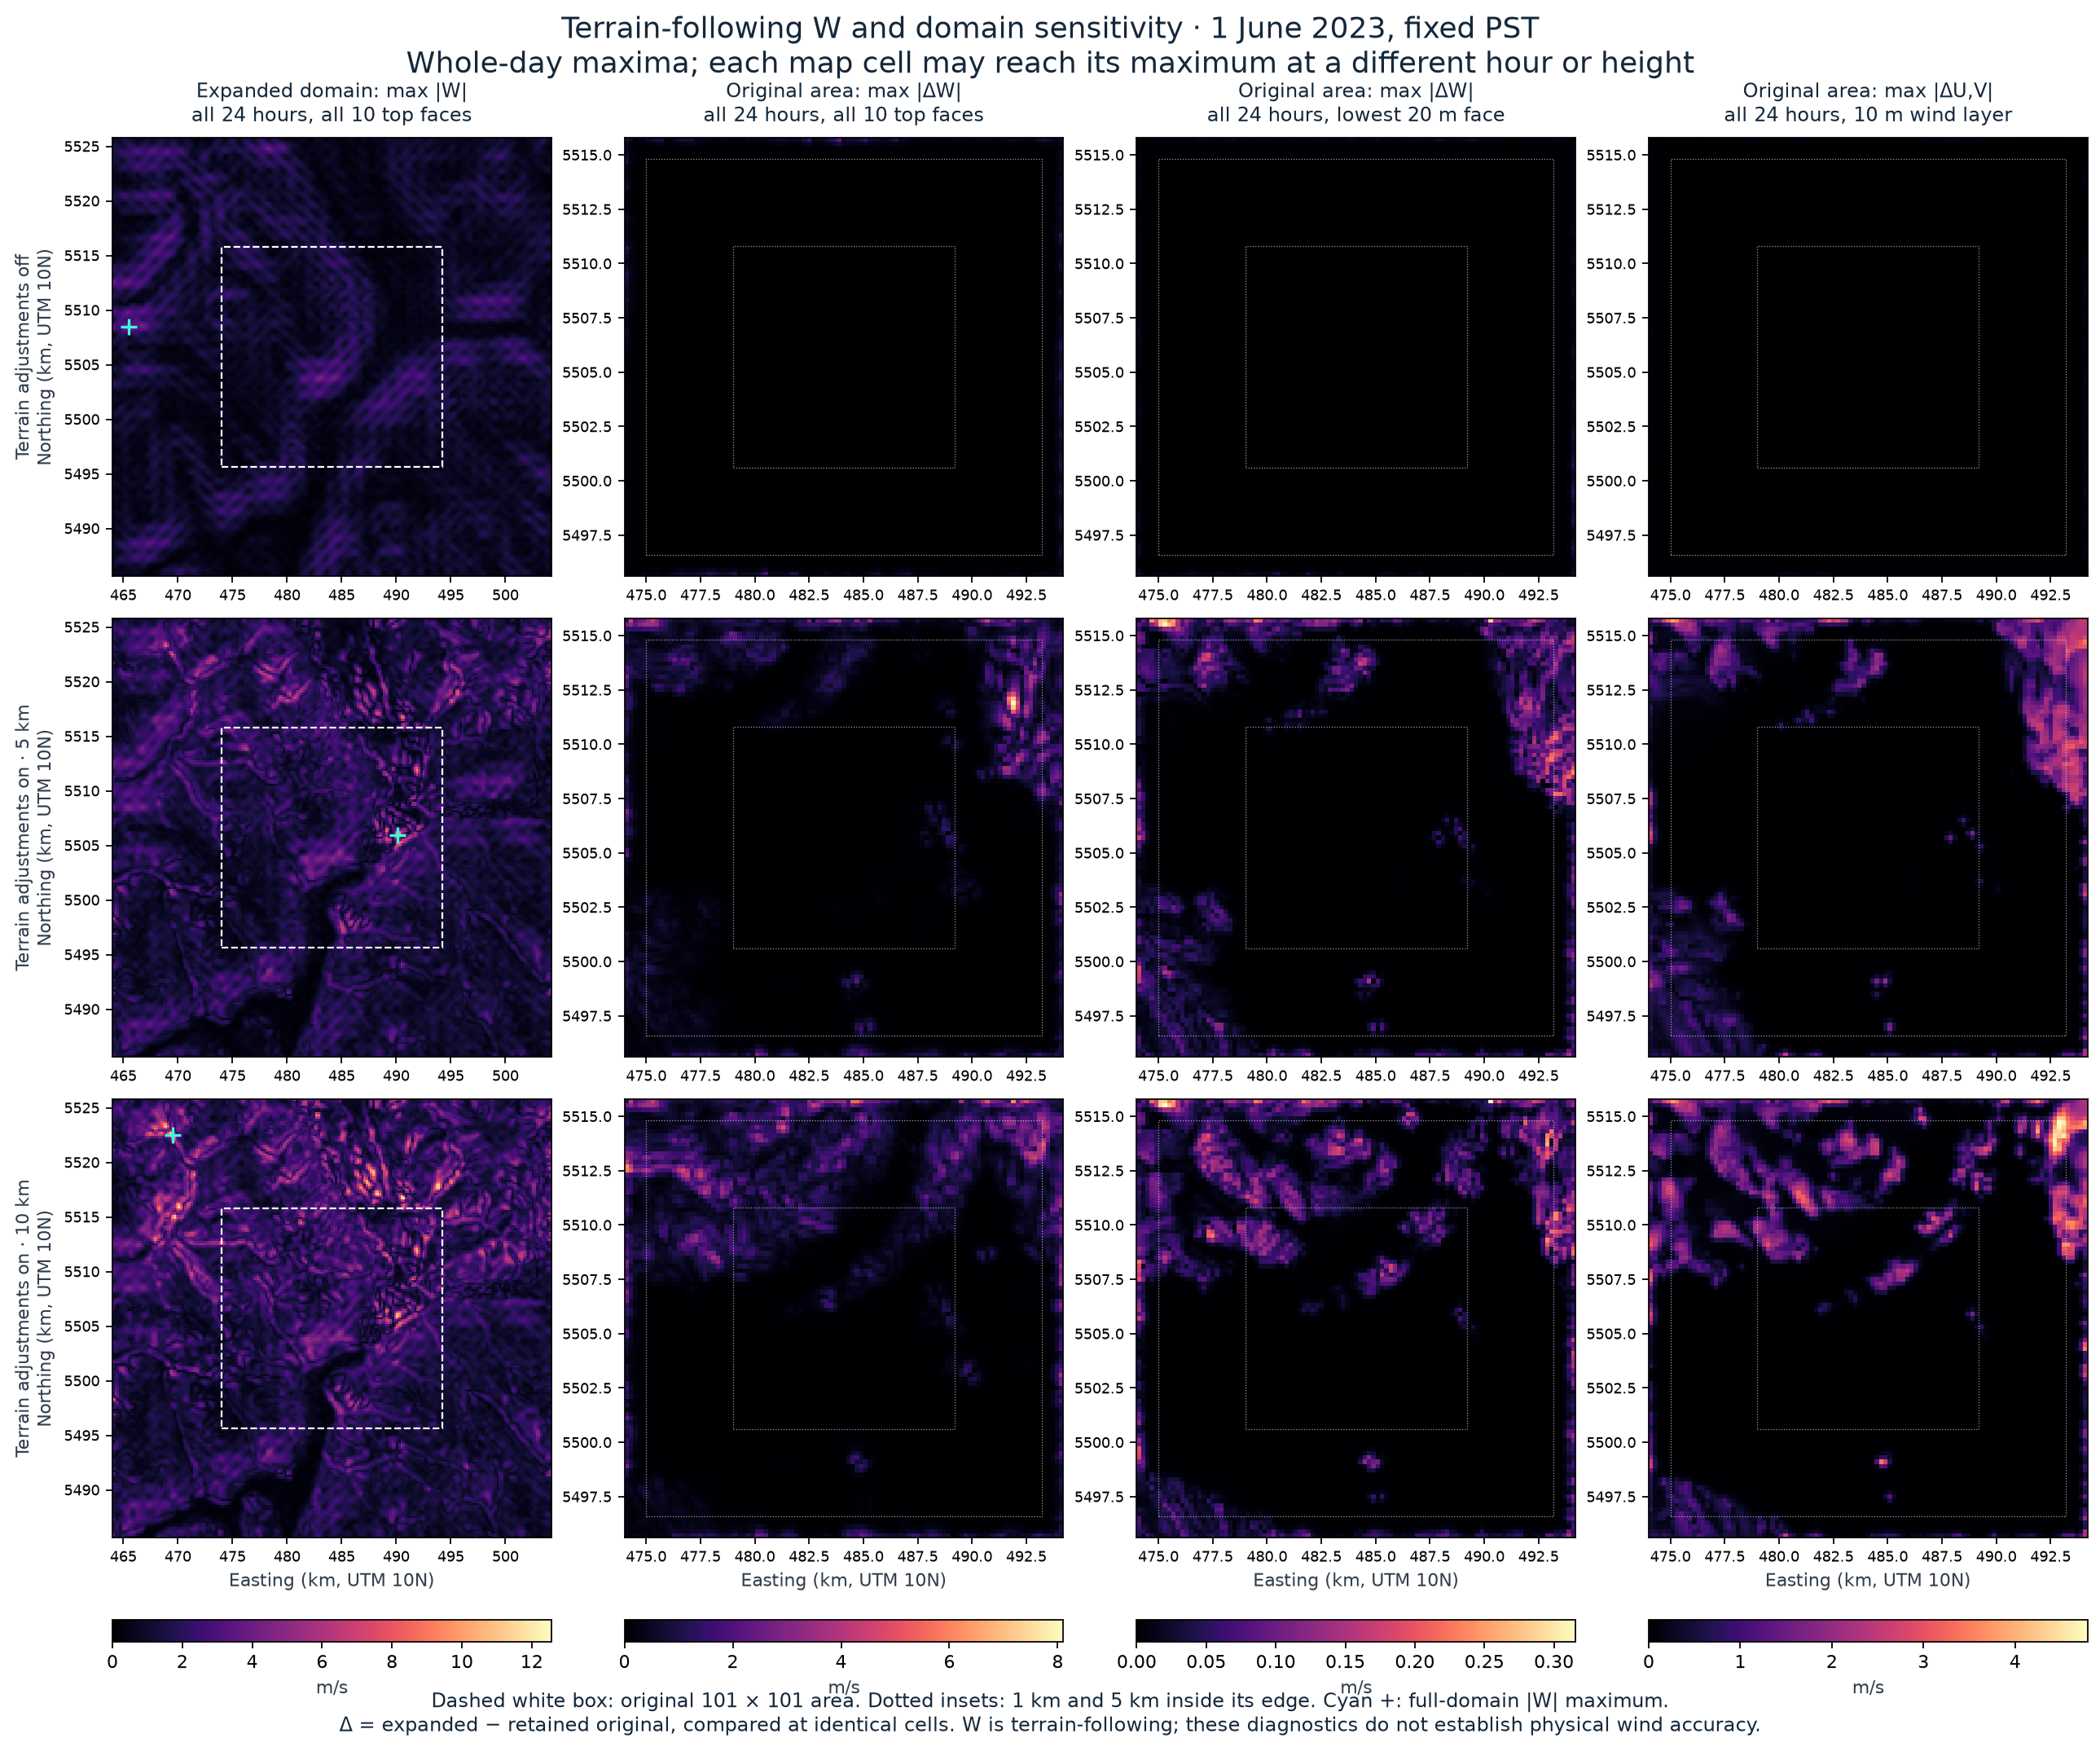
Follow-through: the vertical-coordinate reconstruction now estimates physical vertical velocity under two collocation methods. The tables below retain their original terrain-following W meaning.
11 September 2026 · Saved CALMET results for 1 June 2023 · Follow-up to the larger-domain wind comparison
Adding 10 km of surrounding terrain did not remove the previously identified interior excursion. In the 10 km terrain-radius case, its saved terrain-following component changed from −11.166611 to −11.166899 m/s at the same place, height and interval. The column is 4.1 km inside the original study edge and 14.1 km inside the expanded outer edge. It is not an outermost-cell value.
CALMET’s W is relative to terrain-following coordinates; it is not automatically an Earth-vertical downdraft. Reconstructing its arithmetic explains the saved values and does not establish that the calculated winds are physically accurate.
This read-only diagnostic used all three completed 201 × 201 runs, all 24 intervals and all 10 top faces. It reconstructed W from the saved neighbouring horizontal winds at every expanded interior cell, retaining the earlier 0.00005 m/s arithmetic tolerance. All 28,512,720 interior values passed; the largest absolute residual was 0.0000015974 m/s. The retained original binaries also matched their frozen wind arrays exactly, and their interior equations were rechecked.
With IOBR = 0, the inspected source resets W to zero and integrates horizontal divergence upward, using centred horizontal differences over 400 m and the declared layer thicknesses. The lowest W is on the 20 m top face; the corresponding horizontal wind is in the layer centred nominally at 10 m. Source locators, input hashes and all results
All times below are saved intervals in fixed PST (UTC−8). For example, the earlier “20:00” label means 20:00–21:00, driven by native wind at 21:00. The field is not a start/end wind average. This clarifies labels without changing matching intervals or statistics. Timing source review
The table shows the signed W at each maximum absolute magnitude. The expanded full domain includes added terrain; it is a different spatial population from the original area.
| Case | Original-area maximum, retained run | Same area, expanded run | Full expanded-domain maximum |
|---|---|---|---|
| Adjustments off | -4.364421 | -4.364421 | +4.509260 |
| Terrain, 5 km | -10.921475 | -10.921640 | -10.921640 |
| Terrain, 10 km | -11.166611 | -11.166899 | +12.556588 |
Values are m/s. Both terrain cases retain their original-area extreme at approximately 49.70553° N, 123.13730° W, on the 1,500 m face, in the 20:00–21:00 interval. The 5 km value changes by −0.000165 m/s; the 10 km value changes by −0.000288 m/s. These small changes concern this selected extreme column, not the whole original area.
The new full-domain 10 km maximum is +12.556588 m/s on the 2,200 m face, in 12:00–13:00, near 49.85414° N, 123.42430° W. It lies northwest of the original rectangle, about 8.07 km from it and 3.3 km inside the expanded outer edge. The full-domain 5 km maximum remains inside the original area; the adjustments-off maximum moves into added western terrain, 1.5 km from the expanded edge.
Bands were declared before calculating the new metrics. Distances run from cell centres to the original rectangle’s edge, inside that rectangle. The perimeter centres are 100 m from the edge, not zero. The bands contain 400, 1,520, 5,680 and 2,601 cells respectively. Each entry below is mean / maximum absolute W change, over every interval and top face, in m/s.
| Distance inside original edge | Adjustments off | Terrain, 5 km | Terrain, 10 km |
|---|---|---|---|
| 0–200m | 0.080595 / 2.306306 | 0.171001 / 4.336829 | 0.229284 / 6.163906 |
| 200–1000m | 0.010760 / 0.860824 | 0.058775 / 3.617636 | 0.082506 / 5.119883 |
| 1–5km | 0.000004 / 0.002043 | 0.020337 / 8.102567 | 0.041789 / 4.914830 |
| >5km | 0.000000 / 0.000000 | 0.000681 / 1.456712 | 0.015687 / 2.338762 |
For adjustments off, 99.948% of summed absolute W change lies within 1 km of the old edge, and all values more than 5 km inside are unchanged. The source’s boundary and smoothing path is consistent with this concentration; this is not a complete causal decomposition.
Terrain cases also change farther inward. The 5 km case’s largest difference is −8.102567 m/s, 2.3 km inside the old edge, on the 1,000 m face in 20:00–21:00: −1.307430 becomes −9.409997 m/s. The 10 km case’s largest difference is +6.163906 m/s at an old perimeter centre, 100 m inside the west edge, on the 2,200 m face in 16:00–17:00: +0.346173 becomes +6.510078 m/s. The changes therefore cannot all be described as copied perimeter values.
At the lowest 20 m face, the largest absolute changes are 0.051903, 0.308340 and 0.315494 m/s for adjustments off, 5 km and 10 km respectively. The off-case maximum lies 100 m inside the old east edge; both terrain-case maxima lie 300 m inside its north edge in 15:00–16:00. The 10 km case still has a maximum 20 m-face change of 0.176302 m/s more than 5 km inside. These are W differences, not the horizontal wind changes mapped separately below.
The maps use all 24 intervals; each cell can attain its maximum at a different time or height. Shared colour scales within each column preserve comparison across cases. The complete tables also retain signed ranges, all faces, expanded outer-edge bands and both terrain-radius comparisons. The original-area mean absolute 5-versus-10 km W difference increases from 0.091296 to 0.105657 m/s after enlargement, while its maximum decreases from 9.716681 to 6.703438 m/s. Neither direction establishes accuracy.
The exact source path is WINDBC → SMOOTH → DIVCEL → vertical integration. WINDBC copies the normal U/V edge components into boundary arrays before smoothing. SMOOTH changes U/V in place; DIVCEL then uses the earlier boundary arrays for missing neighbours at the outer perimeter. The next boundary-array refresh occurs after divergence has been calculated. W itself is not copied from an adjacent cell. Provider source · Exact routine/line locators and source hash
Those earlier boundary arrays are absent from the saved wind file. Using final saved edge U/V as substitute boundary values leaves maximum perimeter differences of 1.104841, 4.451438 and 5.159657 m/s across the three expanded cases. These are results of an explicitly hypothetical substitution, not model-error estimates. Exact perimeter reconstruction is therefore not claimed. The interior check uses only saved neighbours and does not require this assumption.
The persistent interior excursion needs evaluation of terrain representation, stability, resolution and observed vertical structure. The larger domain supplies the declared terrain searches within the original area; it does not establish physical boundary adequacy or validate W. No model settings were tuned and no dispersion or exposure conclusion follows from this diagnostic.
All numerical checks · Methods, frozen protocol, tables and source locators