5 September 2026 · Research methods · Historical observations, April 1982–March 1983
An experimental plume treatment reduced error in this historical stack case while increasing the underestimate of average concentration. We compared AERMOD 26135’s default and highly buoyant plume (HBP) treatments with processed observations from ten monitors around the Baldwin coal power plant. The result helps investigate plume penetration and later downward mixing, which control the peaks in our earlier historical Woodfibre screening. It does not supply a correction factor for Woodfibre or change the public explorer’s concentrations.
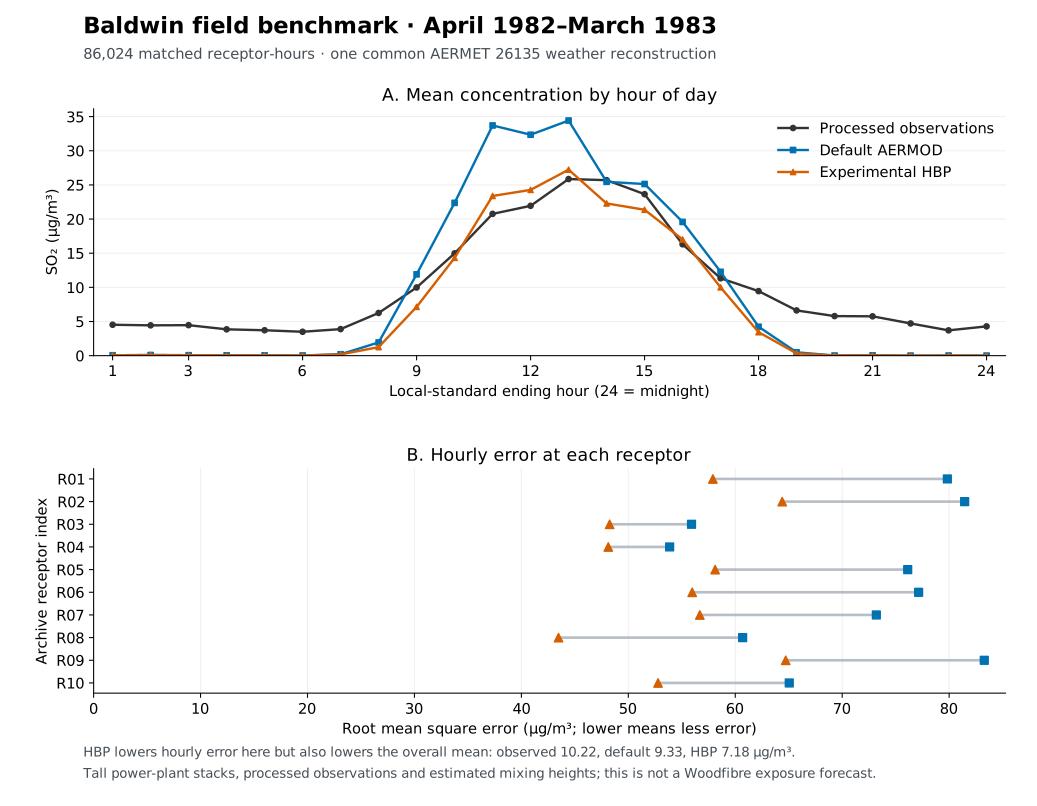
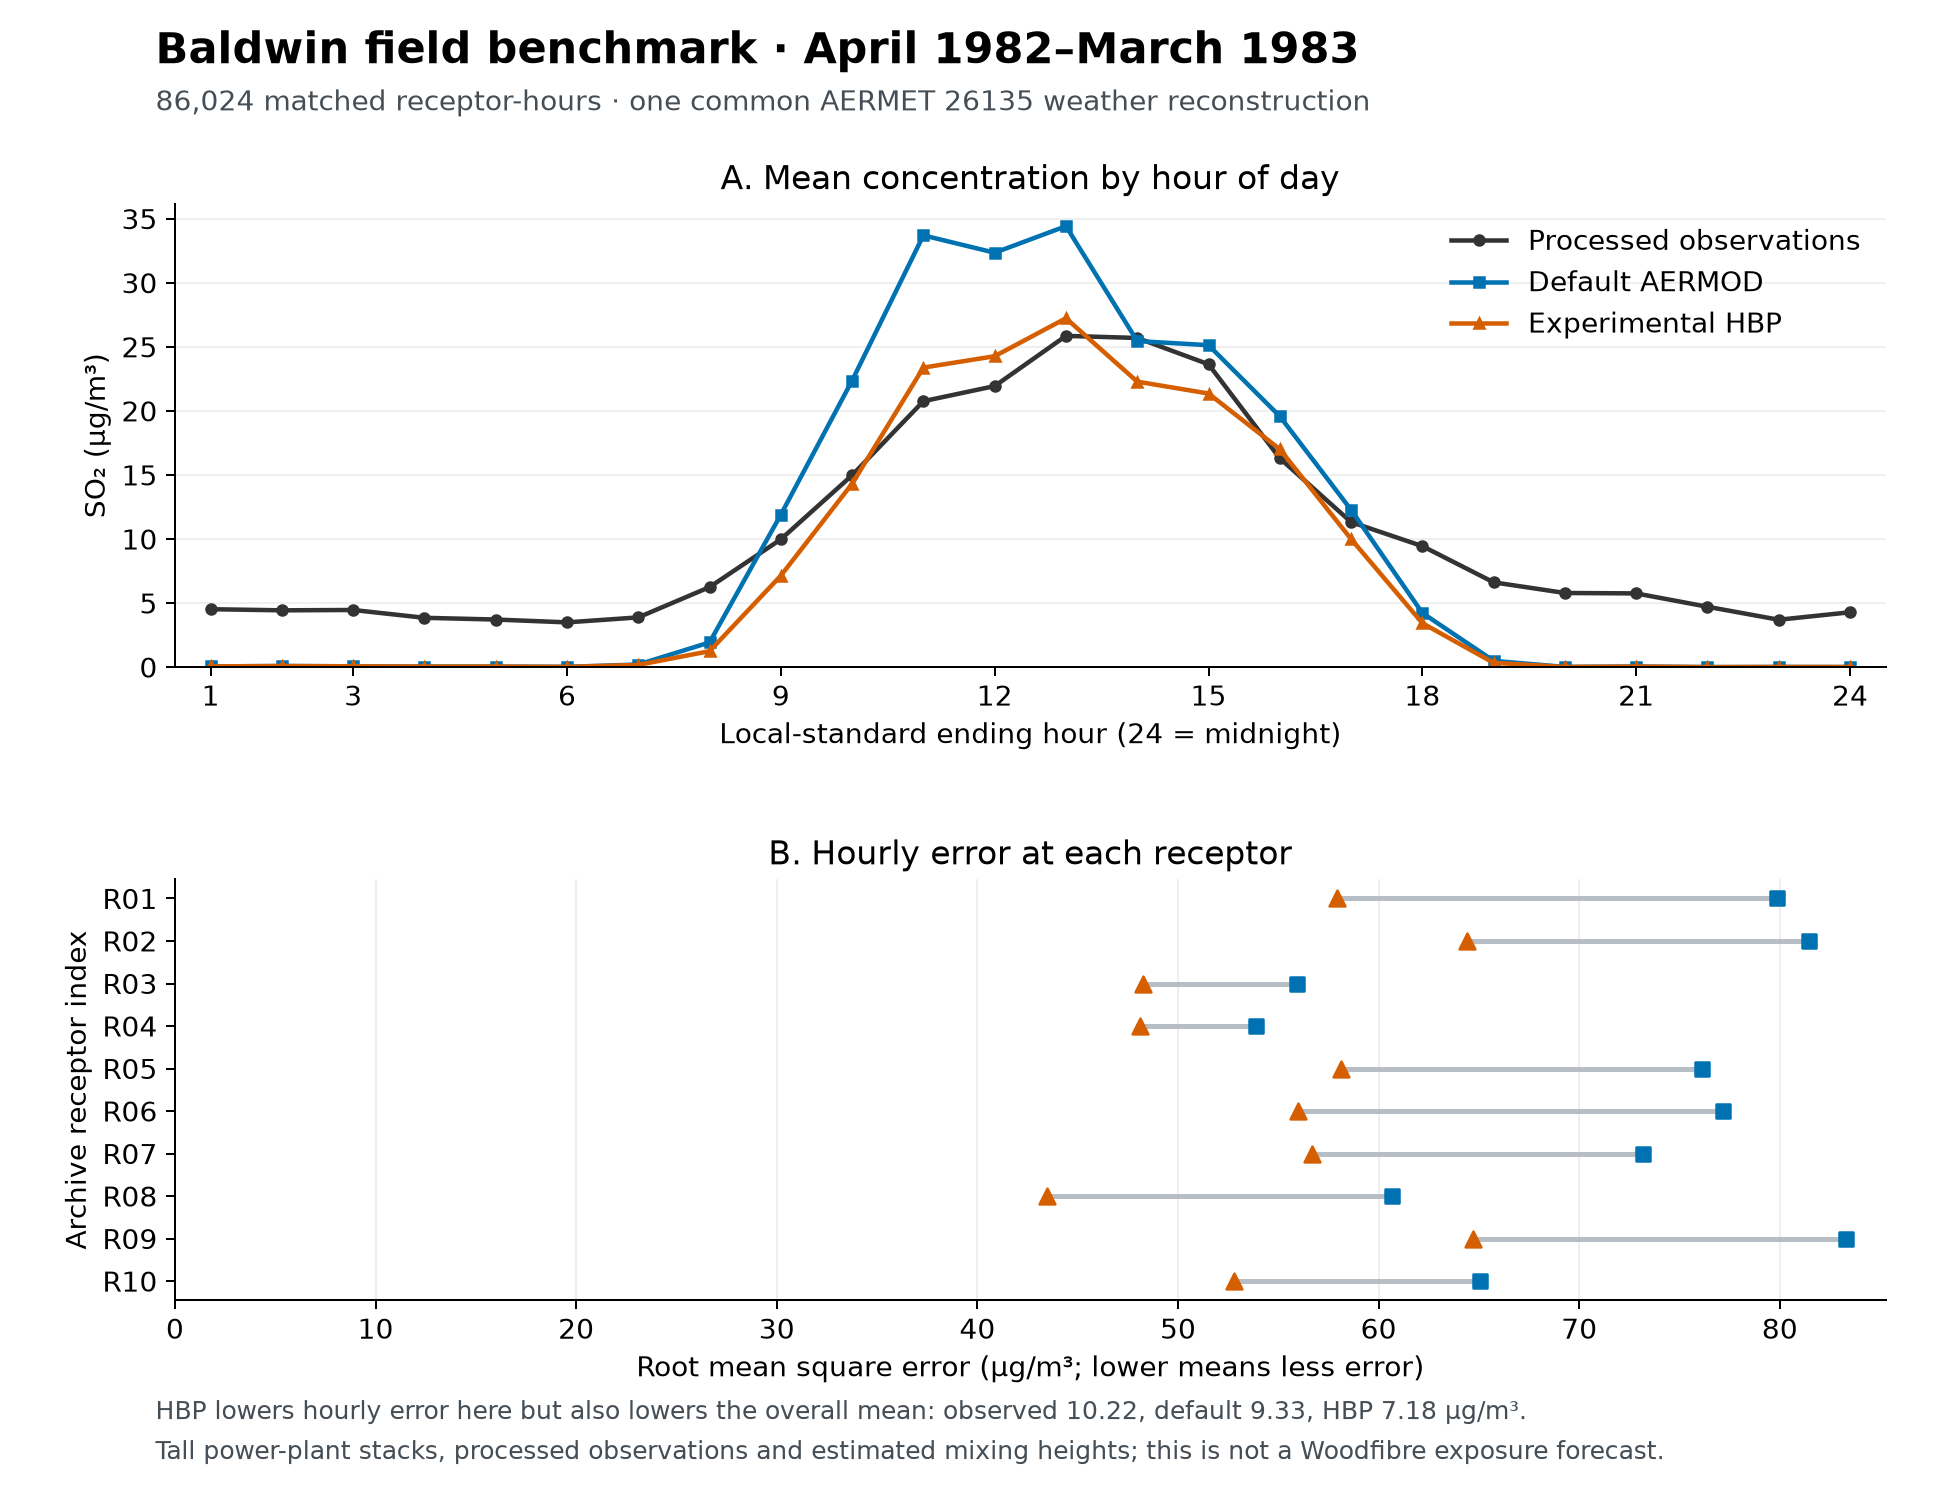
The pooled hourly mean absolute error fell from 14.506 to 12.737 µg/m³ and root mean square error from 71.427 to 55.451 µg/m³. The mean concentration, however, fell from 9.333 to 7.178 µg/m³, against an observed mean of 10.215 µg/m³. Error fell at each of the ten receptors when measured by hourly RMSE. These are descriptive results for one dataset and one common weather treatment, not evidence that HBP is generally superior.
The left panel includes all 24 ending hours, with observations and models averaged over their common valid pairs. The right panel shows hourly error at every receptor. Local standard time is retained throughout; no daylight-saving adjustment or fitted time shift was introduced. Download the vector figure.
The EPA Baldwin archive provides three 184.4 m stacks, hourly emissions, weather and processed SO₂ observations for 1 April 1982–31 March 1983. We retained all three source geometries, hourly emission rates, temperatures and velocities, active directional building dimensions, and ten receptor coordinates and elevations. Receptors have zero flagpole height above their local ground elevation; this is distinct from the 1.5 m height used in our separate historical flare screening.
The three runs used the same source files, receptors and newly processed weather: default AERMOD, an ALPHA control with no experimental plume switch, and ALPHA with HBP selected for all three sources. Default and ALPHA control matched at every one of the 87,600 printed hourly receptor values. Their equality supports attributing their differences from HBP to that option within this configuration.
HBP is an experimental ALPHA option in the AERMOD 26135 user guide. This run does not establish its acceptance for a B.C. assessment. Baldwin has tall coal-plant stacks, limited terrain relief and historical processed observations; it does not test LNG flare combustion or Howe Sound’s wind field. The dataset has been used in prior model development and evaluation, so it is not an unseen holdout.
There are 86,024 common valid observation–model pairs across the ten receptors. All concentration and error statistics below are in µg/m³ SO₂, except correlation. “Observed” means the archive’s processed evaluation values, not unadjusted ambient readings.
| Statistic | Observed | Default = ALPHA control | HBP |
|---|---|---|---|
| Mean concentration | 10.215 | 9.333 | 7.178 |
| Mean bias (model − observation) | — | -0.882 | -3.037 |
| Mean absolute error (MAE) | — | 14.506 | 12.737 |
| Root mean square error (RMSE) | — | 71.427 | 55.451 |
| Pearson correlation, unitless | — | 0.271 | 0.325 |
| Robust highest concentration (RHC) | 2,348.132 | 3,530.456 | 1,509.474 |
MAE measures the average absolute mismatch. RMSE gives more weight to large mismatches. The more negative HBP mean bias indicates a larger average underestimate. Its lower error and higher correlation coexist with that shortfall.
RHC is an upper-tail distribution statistic, not a maximum or a time-matched peak prediction. Using the EPA July 2026 evaluation’s formula, printed p. 32, it equals the 26th largest value plus the difference between the top-25 mean and that value, multiplied by ln(77/2). It can exceed the actual maximum. The observed maximum was 2,090 µg/m³; default and HBP maxima were 2,970.839 and 1,384.268 µg/m³. These maxima need not occur at the same receptor or hour. The default upper tail is higher than observed by this measure, while HBP’s is lower.
We rebuilt three-hour and daily concentrations from the valid hourly pairs, using the same hours and denominator for observations and every model. Counts below are receptor-period pairs, not independent days. Original supplied three-hour/daily observation files were not scored: their aggregation convention records 398 wholly missing three-hour blocks and 13 wholly missing days as zeros.
| Averaging rule | Pairs | Observed mean | Default MAE / RMSE | HBP MAE / RMSE |
|---|---|---|---|---|
| Three-hour blocks, all 3 hours valid | 28,506 | 10.223 | 13.346 / 55.167 | 11.716 / 43.568 |
| Daily, at least 18 of 24 hours valid | 3,571 | 10.211 | 10.786 / 24.116 | 9.565 / 20.271 |
| Daily, all 24 hours valid | 3,372 | 10.366 | 10.762 / 23.525 | 9.572 / 20.048 |
The predefined weather subsets show why a pooled mean alone is insufficient:
| Prepared-weather category | Hourly pairs | Observed mean | Default mean | HBP mean |
|---|---|---|---|---|
| Stable | 49,267 | 5.088 | 0.063 | 0.063 |
| Convective | 36,757 | 17.088 | 21.758 | 16.715 |
| Convective, increasing mixing height | 32,687 | 17.896 | 23.257 | 17.894 |
The stable-period shortfall remains in both treatments. Its cause is unresolved; these calculations do not distinguish source, meteorological, dispersion or observation-processing contributions to the mismatch. Stable and convective categories come from preprocessed Monin–Obukhov length. The growing category additionally requires a positive current convective mixing height and a higher positive next-hour height. They are not measured inversion profiles, and the growing category is a subset of convective hours.
HBP changed 24,575 common valid receptor-hour values, all decreases. The full output includes 25,097 changed printed values across 3,407 hours, including records without valid observations. No favourable day was selected after inspecting the scores. Per-receptor results, quantiles and every ending-hour profile are retained in the downloads.
A prospective protocol was frozen before the current concentration runs and HBP scoring. The old archive weather was produced by AERMET 02222; AERMOD 26135 rejected it with a fatal version-compatibility message, even though the process returned a zero exit status. Appending documented missing fields fixed record length but did not resolve that version rejection. Both failed trials are preserved. The version header was not forged and screening mode was not used to bypass the restriction.
A second frozen protocol amendment allowed legitimate reprocessing of the archive’s raw weather with unchanged AERMET 26135. It retained raw bytes, standard-time conventions, two onsite measurement levels, the original sounding substitutions, wind threshold and 48 monthly/sector surface-characteristic combinations. The legacy controls were translated to current processing stages. A required upper-air station elevation of 175 m was taken from all 722 raw sounding headers. Current preprocessing changed boundary-layer estimates, so this is not an exact reproduction of a published EPA evaluation or a comparison that isolates changes from legacy AERMET. All three new concentration runs share the same newly generated weather files.
Important inherited or default treatments remain documented: five dates use sounding substitutions made by the original preparers; turbulence inputs are missing; pressure uses the standard fallback rather than measured pressure; relative humidity remains missing. Default cloud interpolation was enabled but filled no values. Reference winds match raw onsite records at their stated height: 10 m except one hour using 100 m after the lower-level wind failed the retained 0.3 m/s threshold. Three raw profile cells are output as missing under that threshold treatment. These are not claims that all raw values or every original preprocessing algorithm were preserved.
Each dispersion run retained 8,760 consecutive hours but calculated only 8,759. The final hour—31 March 1983, hour ending 24—lacks valid boundary-layer weather and is excluded despite its printed zero concentrations. There were no model calm hours. Missing observations (−999) are excluded; 69,303 processed observed zeros remain in the common pairs. No additional background subtraction, unit conversion, source multiplier, chemistry, deposition or calibration was applied. The original EPA evaluation, printed p. 15, describes background-adjusted evaluation observations; the exact Baldwin recipe and an explicit observation-column dictionary remain unresolved. Receptor indices are primary; monitor names are supported by archived order and published location information.
Three separate AI-assisted audits checked raw-weather preservation and clocks, model structure and diagnostics, and scoring. The independent scoring implementation read the original observation and model files directly and matched all 3,035 checked fields, with only floating-point rounding differences. All 214,960 HBP diagnostic records matched the applicable current/next mixing-height fields, with a maximum discrepancy of 0 m. The final missing hour follows stable weather, so this file does not test every possible convective-to-missing or end-of-file branch. These checks are reproducibility checks, not qualified independent scientific review.
All production runs completed without fatal errors. Retained messages include the multi-year SO₂ output-processing warnings and the final incomplete three-hour/missing-hour messages. We calculated the reported period statistics ourselves from matched hourly files, rather than interpreting native regulatory design-value output. The full warning and failed-attempt records accompany the archive.
The benchmark provides a working, audited comparison of two plume formulations on chronological field data. The lower HBP errors justify further investigation; the larger mean underestimate and stable-period mismatch prevent choosing it on this evidence alone. This result does not change the browser map, establish B.C. objective attainment, or identify health-risk areas.
Next work should resolve observation processing and receptor metadata, test a separately specified second dataset with compatible source and weather records, and examine plume-height observations alongside ground concentrations. Any new weather treatment or parameter sensitivity should have its own fixed protocol and remain separate from this first benchmark. For Woodfibre, current flare heat/emission histories and simultaneous local vertical weather remain the most consequential inputs. See the modelling roadmap and prior plume-component diagnostic.
The archive retains the original EPA download, protocols, raw-data provenance, current processing controls, native outputs, failed attempts, scripts and audits. Exact model versions and executable hashes are recorded. Scientific model source was not modified. Scripts contain documented local-workspace paths; the archive README explains how to reproduce the calculation in a separate workspace.