Prepared 5 September 2026. Observation benchmark for model evaluation; no plume prediction.
The large difference between airport and marine winds persists beyond the first three-day example. In 2025, there were 914 simultaneous observations when Squamish Airport reported calm and Pam Rocks reported at least 5 m/s. That is 10.47% of the 8,730 usable pairs. The result supports testing the source–fjord–community wind field at multiple locations before using airport weather to predict plume travel.
The observations come from the ECCC National Climate Archive: Squamish Airport, climate ID 10476F0 and Howe Sound – Pam Rocks, 10459NN. Original responses, timestamps and flags are preserved. ECCC provides anonymous public access through MSC GeoMet.
| Quantity | Squamish Airport | Pam Rocks |
|---|---|---|
| Scheduled observations in the 2025 PST calendar year | 8,760 | 8,760 |
| Retrieved rows with usable wind vectors | 8,741 | 8,748 |
| Absent timestamps | 19 | 12 |
| Reported calm readings | 3,509 | 419 |
| Calm share of retrieved usable readings | 40.14% | 4.79% |
There were 8,730 simultaneous usable wind pairs, leaving 30 scheduled timestamps unavailable for the paired calculation. All retrieved wind fields were numeric and had null flags. A null flag alone does not establish a final validation level. Missing hours were not filled. All 17,489 records' supplied UTC times were checked against fixed PST plus eight hours, including summer.
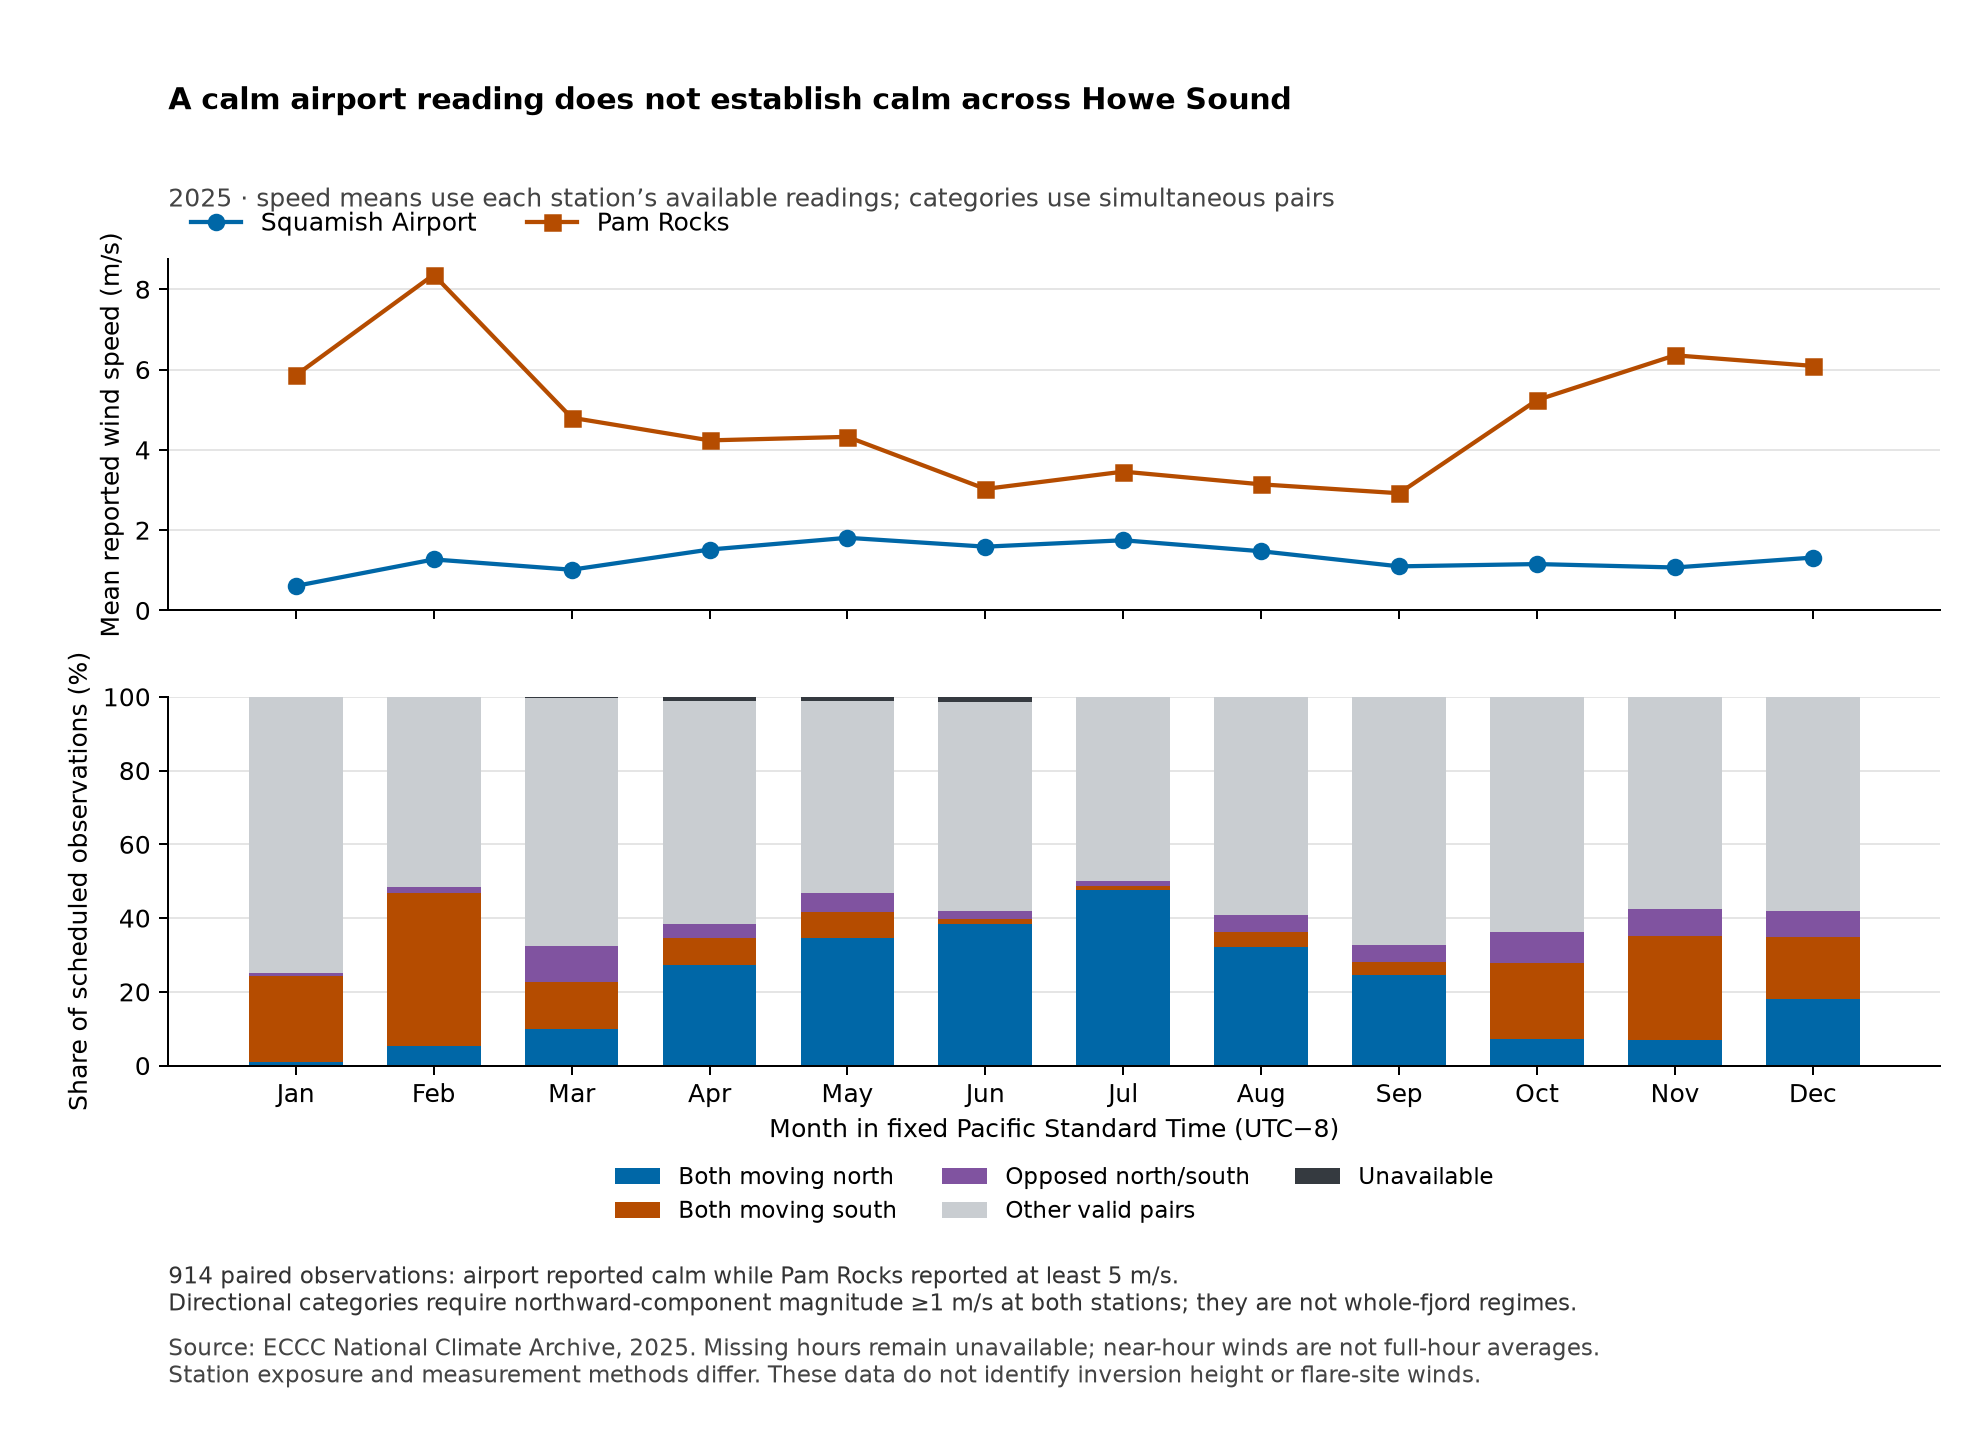
The upper figure’s monthly mean speeds use each station’s own available readings, including reported calm. The lower figure’s categories use simultaneous pairs, with unavailable pairs shown separately.
The mean observed vector difference was 4.31 m/s. This measures differences between two instruments at different locations; it is not forecast error. It includes differences in atmospheric flow, exposure and measurement characteristics. The source site's wind is not inferred from either station.
When both stations reported speeds of at least 1 m/s, their directions differed by at least 90° in 766 of 4,204 pairs; the median difference was 30°. Low-wind direction handling matters: corresponding counts were 983 of 5,039 at a 0.5 m/s cutoff, and 253 of 1,981 at 2 m/s. These are disclosed analysis cutoffs, not claimed instrument specifications. Reported calm retains zero speed and an undefined bearing.
ECCC describes the near-hour observations and their averaging conventions in its climate glossary. An hourly timestamp does not make the wind reading a full-hour average. A sequence of hourly observations cannot establish uninterrupted flow between readings or the wind at flare height.
The lower figure groups the northward component at the two stations. The three directional categories require at least 1 m/s in that component at both stations: both moving north, both moving south, or opposed components. Other valid pairs include calm, weaker and more crosswise winds. Unavailable pairs remain a separate category. The percentages use every scheduled timestamp in the month.
These are transparent two-station categories, not diagnoses of whole-fjord inflow, outflow or temperature inversions. The accompanying audit repeats their annual counts at 0.5 and 2 m/s to show threshold sensitivity.
An observation-only selection found 356 runs with at least three consecutive qualifying observations and retained the longest run in each category and meteorological season: 12 candidate test episodes. Ties use the earliest start time. Missing hours break a run. January–February and December are labelled DJF within this calendar year; they do not constitute one contiguous winter.
For example, both stations had southward components of at least 1 m/s for 103 consecutive observations from 2 February at 09:00 PST to 6 February at 15:00 PST. Mean reported speeds across those observations were 3.06 m/s at the airport and 16.79 m/s at Pam Rocks. A candidate weather reconstruction should be able to reproduce such a spatial contrast. Those observations alone do not specify inversion depth or the winds at Woodfibre.
The selected episode table records exact UTC/PST endpoints, counts and an explicitly chosen 12-hour context window before and after each run. That padding is for examination, not a justified model spin-up period. The complete qualifying inventory preserves all alternatives.
This selection deliberately supplies demanding examples. It is not a representative probability sample and cannot replace withheld seasons, additional years or an unbiased evaluation set. Matching historical numerical-weather fields have not yet been acquired for these episodes. The two September 2026 forecast tests remain separate dated comparisons.
An independent law-of-cosines calculation reproduced all 8,730 Cartesian wind differences to numerical precision. Every candidate run's hourly continuity and category were checked, along with the seasonal selection and monthly denominators. The 705 overlapping wind/temperature fields from the earlier May example were reconfirmed without differences. These are processing checks; they do not certify instrument accuracy or model skill. Processing check, full audit and provenance.
Next, establish archived meteorology for selected dates and compare both raw and locally adjusted predictions against these measurements. Retain additional episodes and stations for independent evaluation. Obtain source-site hourly weather and vertical wind/temperature profiles to test the portion of the flow these two stations cannot observe. A single year is insufficient for a long-term climatology or a representative multi-year dispersion assessment.
The normalized station observations, paired observations with explicit missing timestamps, and monthly calculations are available for review. Original responses and analysis instructions are preserved in the annual wind evidence pack.